Piecewise Function is a function that behaves differently for two types of input. As we know a function is a mathematical object which associates each input with exactly one output. For example: If a function takes on any input and gives the output as 3. It can be represented mathematically as f(x) = 3. But in the case of the Piecewise function, it is defined by individual expressions for each interval.
A piecewise function is defined across different intervals, each with its own specific function rule. A well-known example of such a function is the absolute value. Other examples of piecewise functions include the Heaviside step function, the rectangle function, and the triangle function, each characterized by distinct behaviors over their respective intervals.
In this article, we will study about piecewise function, how to graph a piecewise function, and how to evaluate it.
Piecewise Function
What is Piecewise Function?
Piecewise Function is a function that is defined differently on a sequence of intervals. In other words, a piecewise function is a mathematical function that is defined by multiple sub-functions, with each sub-function being valid only in a certain interval or region of the domain. In other words, a piecewise function is a function that is defined differently on different parts of its domain.
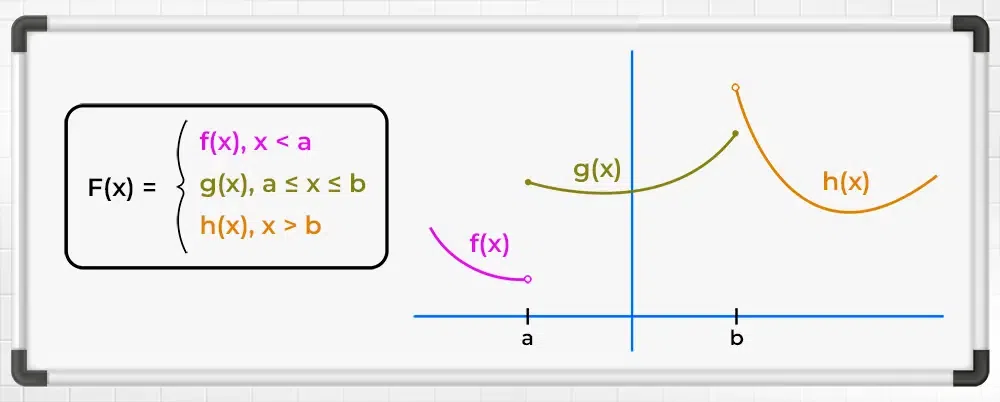
The general piecewise function can be written mathematically as:

Where,
- f1(x), f2(x), and f3(x) are three different functions, and
- a, b, and c are some real numbers.
The above expression for piecewise function means that for x less than a, the function takes on the value of f1(x), for x between a and b, it takes on the value of f2(x), and for x greater than or equal to b, it takes on the value of f3(x).\\
Piecewise Function Definition
A piecewise function, also known as a piecewise-defined function, is a function that is defined by different expressions or formulas on different intervals of its domain. This enables us to accurately describe functions that exhibit varying behaviors or properties within different ranges of input values.
Domain and Range of Piecewise Function
Domain and Range of a piecewise function can be calculated using the domain and range of the individual pieces and taking the union of that range and domains.
Example: Find the Range and Domain of function f(x) which is defined as follows:

Solution:
As the function is defined for all the real numbers, so its domain is R if is defined for some portion of R then that portion becomes its domain.
Now for Range of function, for x<2, f(x) = x, thus range for this part is x<2
For 2 ≤ x ≤ 5, f(x) = 2, thus its range is 2 as it is a constant function for this interval.
For x > 5, f(x) = x2, f(5) = 25 and x2 is continuous and increasing function for x > 0, thus range is x>25.
Now, the union of all the ranges is {x<2} U {2} U {x>25} = (-∞, 2] U (25, ∞)
Piecewise Function Graph
To graph the Piecewise Function, we just need to graph the function individually for all the different intervals it is defined.
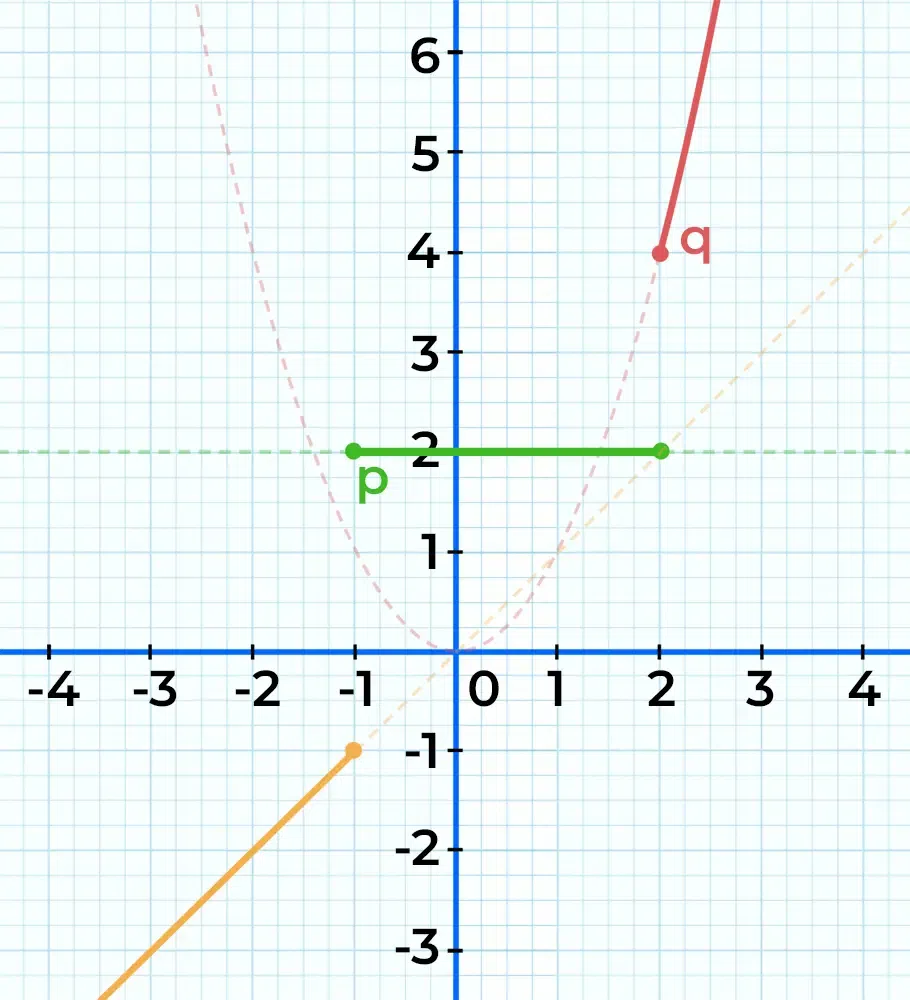
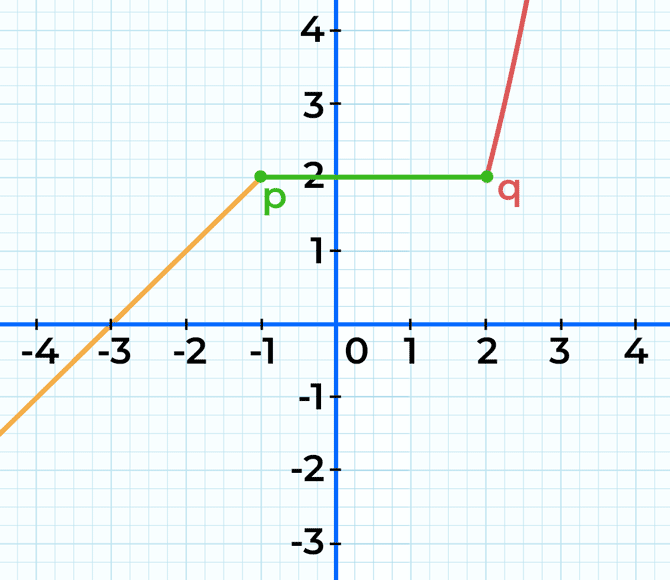
Example: Plot the graph of the function defined as follows:

Solution:
As the domain of the function is the complete set of real numbers, thus there is no such values in R for which the function is not defined.
Now, for the first piece of graph for x < -1, is given as f(x) = x, which can be easily plotted. So the graph of a function for x < -1 is a straight line with a slope of 1 that passes through the origin.
For the second piece of the graph for -1 ≤ x ≤ 2, the given function is a constant function as f(x) = 2. So the graph of a function for -1 ≤ x ≤ 2 is again a straight horizontal line which is at a 2 unit distance from the x-axis.
For the third piece of the graph for x > 2, the given function is a parabolic curve that opens upwards and x2 is a increasing and continuous function, so the graph starts at the point (2, 4) goes in the upward direction as parabolic curve.
Plot these three pieces of the graph to obtain the required graph of the function.
Examples of Piecewise Function
There are many famous examples of piecewise functions, some of which are as follows:
- Modulus Function
- Floor Function
- Ceiling Function
- Unit Step Function
- Signum Function
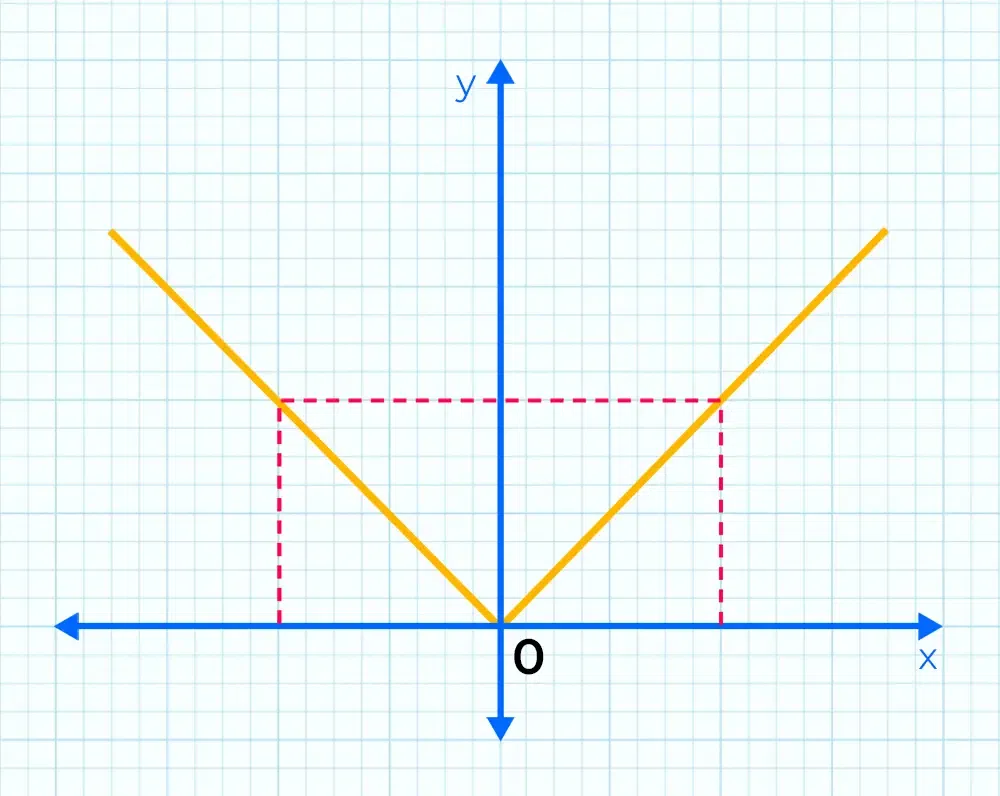
Modulus Function
It is also called the absolute value function, and it is defined in two pieces as follows:

The graph of this function is as follows:
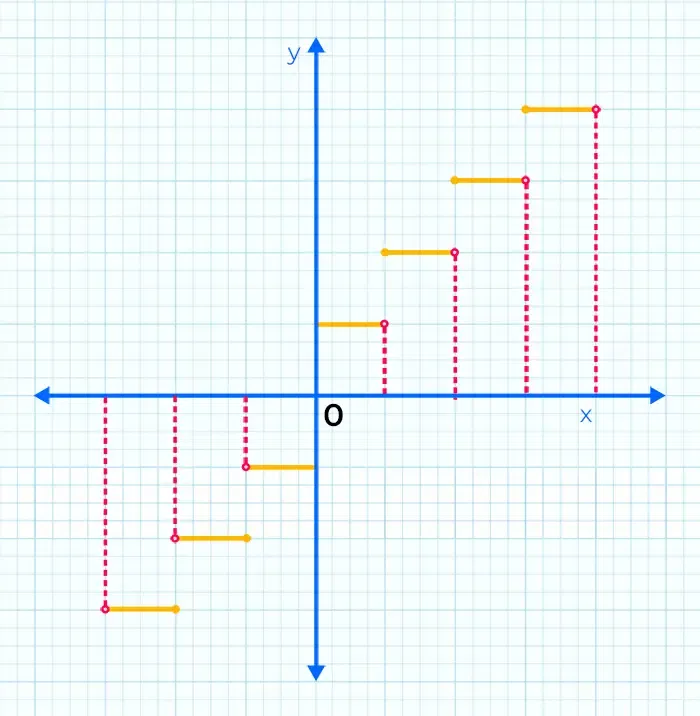
Greatest Integer Function or Floor Function
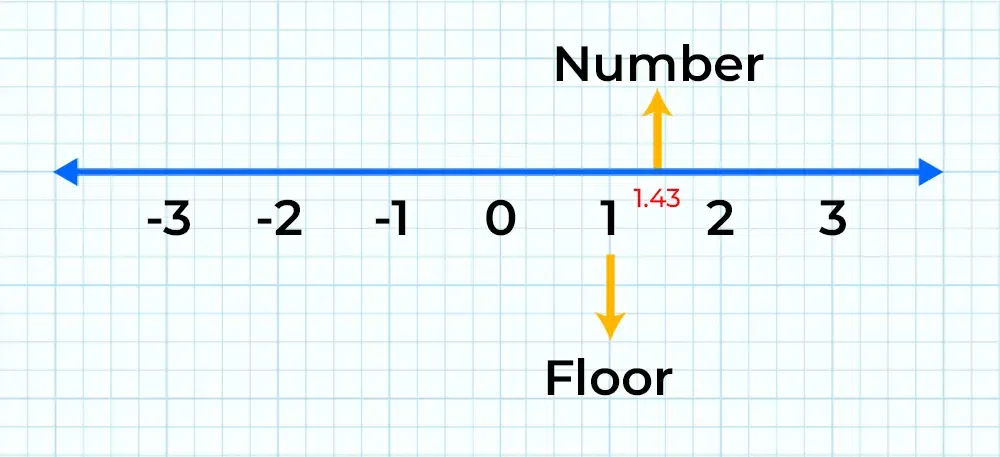
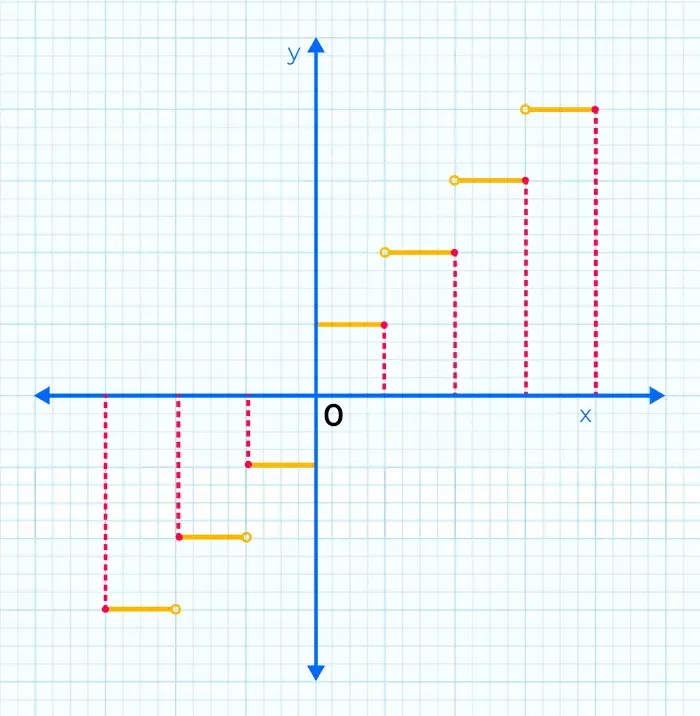
The floor function also called the greatest integer function or integer value, gives the largest integer less than or equal to x. The domain for this function is all the real numbers R while the range of this function is all the integers Z.
Question 1: What is the Floor of 1.43?
Solution:
Floor of a number is the greatest Integer lesser or equal to that number. Therefore, here the Floor of 1.43 is 1.
Question 2: What is the Floor of -5.66?
Solution:
On Negative axis, the greatest Integer lesser than -5.66 is -6.
Hence, -6 is the Floor of -5.66.
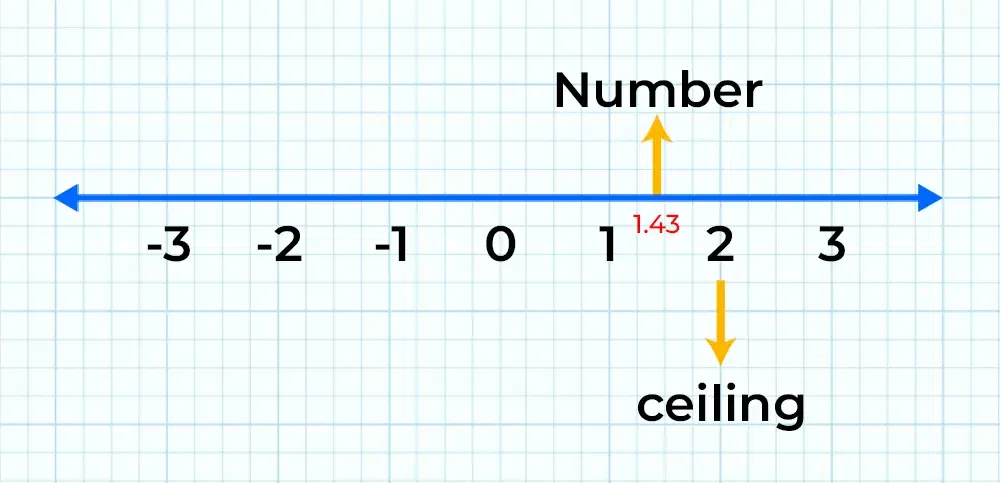
Least Integer Function or Ceiling Function
This function returns the smallest successive integer. The ceiling function of a real number x is the least integer that is greater than or equal to the given number x. The domain for this function is R and range Z.
Similar to the floor function, the domain of the ceiling function is R and the range is all the integers I.
Example 1: What is the Ceiling of 1.43?
Solution:
The ceiling of the 1.43 should be its smallest successive Integer, hence the ceiling of 1.43 is 2.
Example 2: What is the ceiling of -7.8?
Solution:
The smallest successive Integer of -7.8 is -7.
Hence, -7 is the ceiling of -7.8.
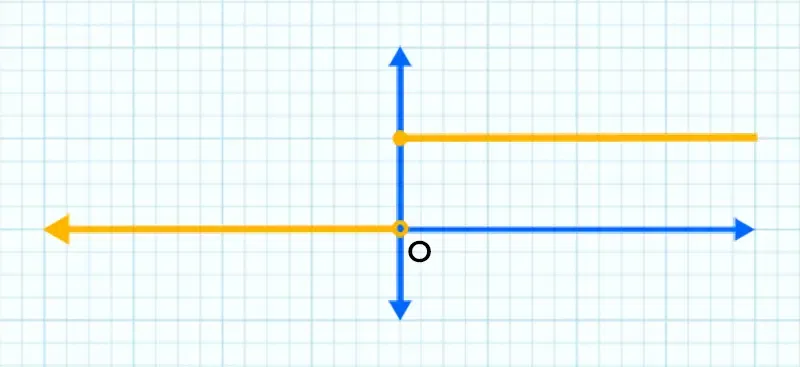
Unit Step Function
Unit Step Function is yet another type of function used a lot in Signals and systems studies. It is defined as,

This function has no value at x = 0. It is called a step function because, at t = 0, it takes a step from 0 to 1. The domain for this function is R – {0} and range {0,1}.
Signum Function
This function shows the polarity of the input number if the number is negative function spits out -1 as output and if the number is positive the signum function spits out +1 as output and for 0 which is neutral in nature signum function spits 0 as output. Mathematically signum function is defined as

The graph of the signum function is as follows:
Evaluating Piecewise Functions
Let’s consider the following examples of piecewise functions to evaluate their value at any given point.
Example: Find the value of the following function at x = -2 and x = 10.

Solution:

at x = -2, x < 0 so the f(-2) = -2.
at x = 10, x > 0, so f(10) = 102 = 100.
Example: An arcade game charges the following prices depending on the length of time:
- Up to 6 minutes costs Rs.10
- Over 6 and up to 15 minutes costs Rs.15
- Over 15 minutes costs Rs.15 plus Rs.1 per minute above 15 minutes
Represent this as a piecewise function and tell the price charged if Anil played the game for 13 minutes and Raju played for 20 minutes.
Solution:
These kind of prices charges can be represented as,

at x = 13, f(13) = Rs.15 and x = 20, f(20 ) = 15 + 1( 20 – 15) = 20.
Piecewise Continuous Function
A Piecewise Continuous Function is a function that is continuous across its entire domain i.e., each piece of the function is continuous itself and all the intersection points are the same for each piece so where each piece ends another piece of function starts from there in the graph.
An example of a Piecewise Continuous Function is given as follows:

This function is continuous across the entire domain because the limit of f(x) as x approaches 0 from the left (for x < 0) is equal to the limit of f(x) as x approaches 0 from the right (For x ≥ 0), and both limits are equal to 0. Therefore, f(x) is continuous at x = 0.
Piecewise Continuous Function Graph
A Piecewise Continuous Function Graph is given below. The graph of a piecewise continuous function often resembles a series of connected segments, each representing the function’s behavior within a specific interval. At the points where intervals meet, the function may experience jumps, breaks, or other types of discontinuities.

Read more:
Continuity of Functions
Let’s consider another example continuous piecewise function as follows:

This function is continuous across the entire domain as  , all exists.
People Also View:
FAQs on Piecewise Function
Define the Piecewise function in Maths.
A Piecewise function is a function that is defined for different sequences of intervals differently.
How do you write a Piecewise Function?
To write peicewise function, we need to write expression for each defined domaine individually. Let’s consider an example as follows:

OR
f(x) = 2x + 1, if x < 0
f(x) = x2, if 0 ≤ x < 2
f(x) = 5, if x ≥ 2
How to Graph a Piecewise Function?
To graph a peicewise function we need to plot the graph of each individual defined expression for given domain.
What is a Piecewise Continuous Function?
If the lower limit and the upper limit of successive sequence of function are same then a piecewise function is continuous. In other words, a piecewise function is continuous when the function is continuous in the entire domain of the given function.
What is a Differentiable Piecewise Function?
If the function is differentiable at all the boundary points as well in the entire domain, the piecewise function is called differentiable.
Give an Example of a Piecewise Linear Function.

This is a piecewise linear function as its graph will be a straight line in all the three pieces.
Share your thoughts in the comments
Please Login to comment...