Lines are the most basic configuration in geometry. Many other geometrical shapes can be obtained from lines. Lines are referred 1-Dimensional. We can obtain higher dimensional shapes using lines. Let’s understand the lines in depth. Let’s say, we have two sets as follows,
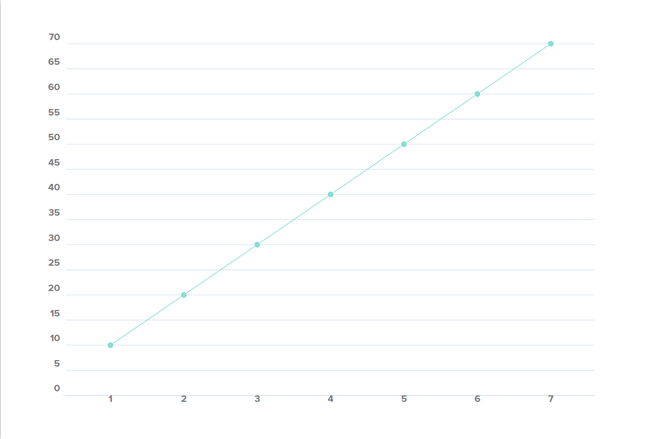
x = {1, 2, 3, 4, 5, 6, 7}
y = {10, 20, 30, 40, 50, 60, 70}
Here, points in set y are the corresponding values to the points in x. Now let’s see, how this graph looks like
Here, we had a limited number of points. Now think, what if we don’t know how many points we will have. To overcome this problem, let’s generalize the concept of lines. Now we are going to define the equation of the line. A general equation of the line is
y = mx + c
Where:
y = values on the y-axis
x = values on x-axis
m = slope of the line
c = a constant, mathematically intercept on the y-axis
Explanation of m (slope of the line)
In mathematical words, it is the tan of the angle made by line with the x-axis. Let’s say the line y = mx + c makes angle theta (θ), then the slope of this line will be
m = tan(θ)
Interpretation of ‘m’
If m < 0:
If m is less than 0, then with increase of value of x, value of y will decrease.
For example, let’s take a line x = -2x + 8 , where m = -2 (which is less than 0) and c = 8 (we will talk about c later on). Then the graph will look like,
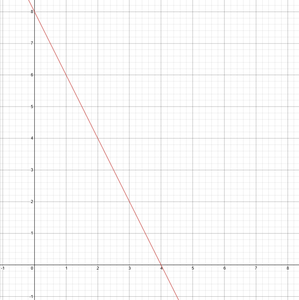
Here we can observe that, with an increase in x, the value of y gradually decreases.
If m > 0:
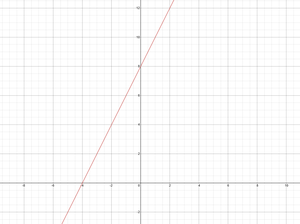
If m is greater than 0, then with increase of value of x, value of y will increase.
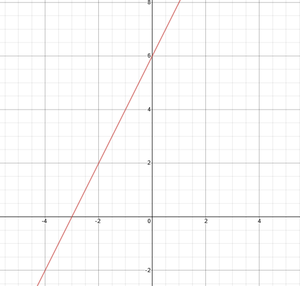
For example, let’s take, y = 2x + 8, where m = 2 and c = 8. Then the graph will look like,
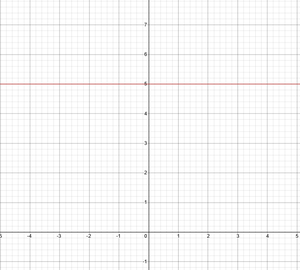
If m = 0:
In this condition, the value of y will stay constant with an increase or decrease in values of x. In this condition, the line will be horizontal (parallel to the x-axis). For example, let’s take y = 5 (we can also write this equation as y = 0x + 5), where m = 0 and c = 5. Then the graph will look like,
Interpretation of ‘c’
Simply coming to the point,
c is the value on y-axis, when our line meets x = 0.
For example, let’s take line y = -2x + 8. If we put x = 0 (which means line meets x=axis), then our line will meet y-axis at y = 8. You can observe it from the graph below.
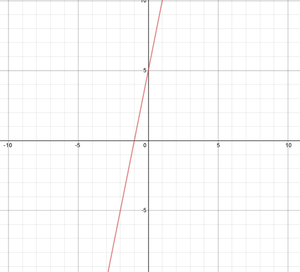
Let’s take another line as y = 2x + 6, then putting x = 0 will result in line meeting y-axis at y = 8.
The solution of more than one line is pairs of x and y, which all the lines satisfy. “In simple words, the solution of lines is the point where all the lines meet.” Let’s understand it by examples.
Example 1:
Let’s say, we have two lines
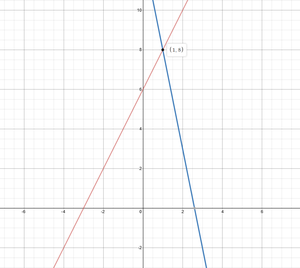
y = 2x + 6 ———— (1)
y = -5x + 13 ———— (2)
If we draw these lines in a plane and find a point where both lines meet, then it will be (1,8). (Make sure that the solution of lines is one and only one point where all the lines meet). Let’s have a look at the graph.
Now, we won’t have time to draw the graphs of each line given. We should have some on-paper method to find the solution of lines. Let’s understand the on-paper approach. From the above lines (1) and (2), let’s pick a line as a baseline (let’s say the baseline is (1).)
Base line is y = 2x + 6
We have variable x and y in both the lines, so now what we will do, we will pick our second line and put the RHS (Right Hand Side) of that second line (2) into line (1) in the place of y. So our 1st line will become,
-5x + 13 = 2x + 6
Solving this equation, we get
x = 1
Now, putting this x = 1 into any of the above two lines, we will get the value of the y. Let’s put the x = 1 into line (1).
y = 2x + 6
y = 2 × 1 + 6
y = 8
So, now we have a pair of values (x, y) = (1, 8).
Here, observe that we get only one point in the plane which is the only solution of the line.
You can apply this method to any pair of lines to get the solution of lines.
Example: 2
Let’s say, we have two lines
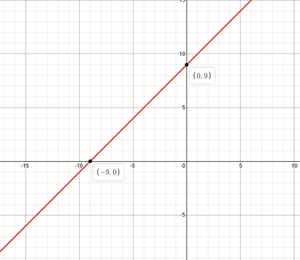
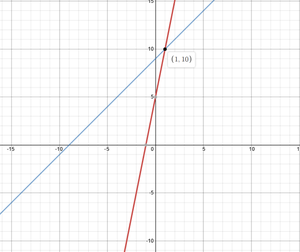
y = x + 9 ———————— (1)
and
y = 5x + 5 ———————— (2)
Now putting the value of y of the equation-1 (i.e., x + 9) into equation-2, we get
∴ y = 5x + 5
∴ x + 9 = 5x + 5
∴ 4x = 4
∴ x = 1
Now we get x = 1, putting this value of x into any of the two equations (let’s put in the equation-2), we get,
∴ y = 5x + 5
∴ y = 5 × 1 + 5
∴ y = 10
So, solution of lines 1 and 2 is (x, y) = (1, 10). You can cross-check, we are getting the same answer if we put the value of x in the equation-1. Have a look at the graph.
Hooray! We get the correct answer. Let’s make this concept concrete by taking one last example (something tricky).
Example 3:
Let’s take lines,
x = 2y + 5 —————— (1) and
y = 2x + 5 —————— (2)
Here, putting value of x of the equation-1 into equation-2 will lead to easy calculations. So let’s put x = 2y + 5 (equation-1) into equation-2.
∴ y = 2 (2y + 5) + 5
∴ y = 4 × y + 15
∴ -3 × y = 15
∴ y = -5
For finding value of x, let’s put y = -5 into equation-1,
∴ x = 2y + 5
∴ x = 2 × (-5) + 5
∴ x = -5
So, solution of lines 1 and 2 is (x,y) = (-5,-5). Try to find the slope of line 1 in this example. It will be (1/2). Try to plot the graph by yourself and see if your answer matches with this answer or note.
Share your thoughts in the comments
Please Login to comment...