Measures of spread – Range, Variance, and Standard Deviation
Last Updated :
04 May, 2021
Collecting the data and representing it in form of tables, graphs, and other distributions is essential for us. But, it is also essential that we get a fair idea about how the data is distributed, how scattered it is, and what is the mean of the data. The measures of the mean are not enough to describe the data and its nature. We also need to measure the dispersion in the data with respect to different statistics of the data. For example, we need to be able to answer the questions like, How much is the dispersion of the surrounding data’s mean, or its median. These values allow us to describe the data in a better way. Let’s look at some of them,
The dispersion, which is also called scatter is measured on the basis of the type of chosen central tendency and the observations available to us. These measures tell us how much the observations are varied or similar to each other. There are many ways of measuring the dispersion in the data, some major ways to measure the spread are given below:
- Range
- Variance
- Standard Deviation
Range
The range of the data is given as the difference between the maximum and the minimum values of the observations in the data. For example, let’s say we have data on the number of customers walking in the store in a week.
10, 14, 8, 10, 15, 4, 7
Minimum value in data = 7
Maximum Value in the data = 15
Range = Maximum Value in the data – Minimum value in the data
= 15 – 7
= 8
Now we can say that the range of the data is 8. This gives us an idea about the spread of the data but doesn’t tell how the data is distributed.
Variance
The variance of the data is given by measuring the distance of the observed values from the mean of the distribution. Here we are not concerned with the sign of the distance of the point, we are more interested in the magnitude. So, we take squares of the distance from the mean. Let’s say we have x1, x2, x3 …. xn as n observations and  be the mean.

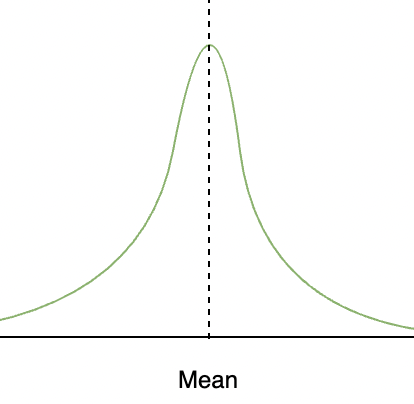
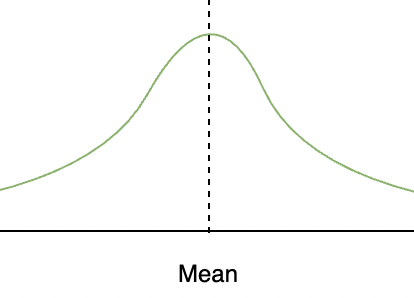
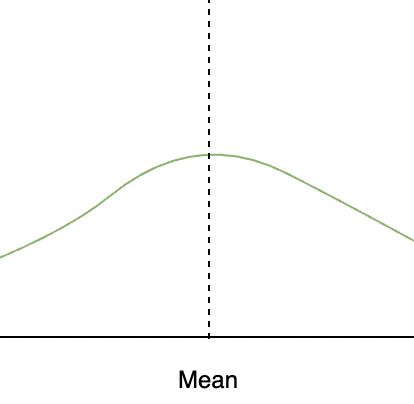
If this sum zero, then each term has to be zero which means that there is no scattering in the data. If it is small, then it means that the data is concentrated at the mean and vice versa for large values of the variance.
But this measure is still dependent on the number of observations in the data. That is if there are lots of observations this value will become large. So, we take the mean of the data,

Standard Deviation
In the calculation of variance, notice that the units of the variance and the unit of the observations are not the same. So, to remove this problem, we define standard deviation. It is denoted as 

Let’s see how to calculate these measures in some problems,
Sample Problems
Question 1: Find out the range of the following data:
Solution:
For calculating the range of a data, we need to find out the maximum and the minimum of the data:
Max = 9
Min = -10
Range = Max – Min
= 9 -(-10)
= 19
Question 2: Find out the mean and the median of the same data:
Solution:
Mean of the data: 
= 
= 1.2
Median is called the middle element of the data.
Median = -10.
Question 3: Let’s say we have the following data,
Calculate the range, variance, and standard deviation of the data.
Solution:
Range
We need to find out the minimum and the maximum values of the data distribution.
Min Value = -6
Max Value = +6
Range = Max Value – Min Value
= 6 – (-6)
= 12
Variance
To find the variance, we first need to find the mean,
Mean = 
= 
= 0.6
We know the formula for Variance,
Variance = 
= 
= 
= 17.82
Standard Deviation
⇒ 
⇒ 
Question 4: Let’s say we have the following data,
Calculate the range, variance, and standard deviation of the data.
Solution:
Range
We need to find out the minimum and the maximum values of the data distribution.
Min Value = -3
Max Value = +3
Range = Max Value – Min Value
= 3 – (-3)
= 6
Variance
To find the variance, we first need to find the mean,
Mean = 
= 0
We know the formula for Variance,
Variance =
=
= 
= 9
Standard Deviation
⇒ 
⇒ 
Question 5: Let’s say we have the following data of the number of TVs sold by a consumer electronics shop over the week,
| Monday | 4 |
| Tuesday | 5 |
| Wednesday | 3 |
| Thursday | 4 |
| Friday | 5 |
| Saturday | 5 |
| Sunday | 3 |
Calculate the range, variance, and standard deviation of the data.
Solution:
Range
We need to find out the minimum and the maximum values of the data distribution.
Min Value = 3
Max Value = +5
Range = Max Value – Min Value
= 5 – (3)
= 2
Variance
To find the variance, we first need to find the mean,
Mean = 
= 
= 2.9
We know the formula for Variance,
Variance =
=
= 0.809
Standard Deviation
⇒ 
⇒ 
Share your thoughts in the comments
Please Login to comment...