MS Excel is a spreadsheet program that is created by Microsoft, for platforms like Windows, macOS, Android, iOS, and iPadOS. It is used for Data Organization, Formatting, Calculation, Data Analysis, and other tasks. If you are seeking a full guide to MS Excel and its formulas, then this MS Excel tutorial is designed for beginners and experienced Excel professionals.
Here in this Excel tutorial, we cover all the basic and advanced-level topics to get from zero to mastery of the MS Excel program.
The tutorial is divided into three sections: Beginner, Intermediate, and Advanced. In each segment, you will explore various subjects that will enhance your Excel skills. You will learn about functions, working with data, sorting, data analysis, advanced charts and graphs, and many other advantages of using Excel spreadsheets.
What is Microsoft Excel?
As we know, MS Excel is a powerful spreadsheet program that is part of the Microsoft Office product group for business applications. This Microsoft Office program allows users to store, organize, analyze, and visualize data in a tabular format.
Its reflexive interface, extensive functionality, and, several formulas make MS Excel simple for users to handle a huge amount of data. Hence, MS Excel is widely used in various industries, including finance, marketing, education, and more.
Why to Learn Excel
Here in this section, you will get to know why this MS Excel tutorial is needed and what are the benefits.
- Enhanced Data Analysis: Excel empowers users to analyze large datasets, identify trends, and draw meaningful insights with its powerful functions and tools.
- Increased Efficiency: Excel’s automation features streamline repetitive tasks, saving time and reducing errors.
- Improved Decision Making: Excel’s clear and visually appealing data organization enables users to make informed decisions in various contexts.
- Advanced Financial Analysis: Excel’s financial functions and modelling capabilities are essential for complex calculations and evaluating investment opportunities.
- Versatility and Integration: Excel seamlessly integrates with other Microsoft Office applications and external data sources, facilitating data sharing and analysis.
- Career Advancement: Proficiency in Excel opens doors to job opportunities requiring data analysis, reporting, and financial management skills, enhancing professional value.
Advantages of Microsoft Excel
MS Excel is widely used for various purposes because the data is easy to save, and information can be added and removed without any discomfort or hard work.
- Easy To Store or Organize Data: Using Microsoft Excel one can easily store or organize large amounts of data.
- Easy To Recover Data: Because Excel is Microsoft product, hence the recovery of data is very easy.
- Easy to Manipulate or Visualization: Excel allows users to easily create data visualizations with charts.
- Direct Application of Mathematical Formulas: Using Excel one can perform mathematical calculations on data sets, such as finding averages, standard deviations, and correlations.
- Free Template: Excel has many free templates to use.
- More Secure: Rather than other Spreadsheet programs Excel is more secure and less venerable.
- Clearer Visibility of Complex Information: Excel store all its data in tabuler for hence, handling of complex data is easy.
Microsoft Excel Features
Anyone can learn how to use and take advantage of the program’s powerful features.
- Excel users can utilize AutoFormat to use predefined table formatting settings.
- AutoSum: The AutoSum function allows us to automatically calculate the sum of a row or column by inputting an addition formula for a range of cells.
- List AutoFill: It creates cell formatting automatically when a new component is added to the end of a list.
- AutoFill: This function allows us to swiftly fill cells with a repetitive or sequential record, such as chronological dates or numbers, or documents that are repeated. Functions can also be copied using AutoFill. This function also allows us to change text and numbers.
- AutoShapes: The AutoShapes toolbar allows us to design geometrical shapes, arrows, flowchart items, stars, and other objects. We can create graphs using these forms.
- Wizard: It assists us in working more effectively by showing many useful recommendations and approaches based on what we are doing. The drag-and-drop capability allows us to reposition the record and text by dragging the data with the mouse.
- Charts: This tool allows you to exhibit data in graphical form by utilizing Pie, Bar, Line, and other charts.
- PivotTable: It flips and sums data in seconds, allowing us to perform data analysis and generate documents such as periodic financial statements, statistical reports, and so on. We can also visualize complex data linkages.
- Shortcut Menus: The shortcut menu assists users in completing tasks by using shortcut commands that need a lengthy process.
Excel Can Be Used For
Getting started with MS Excel Tutorial
The easiest way to get started with Excel is to use Microsoft 365, previously known as Office 365. It does not require downloading or installation of the program.
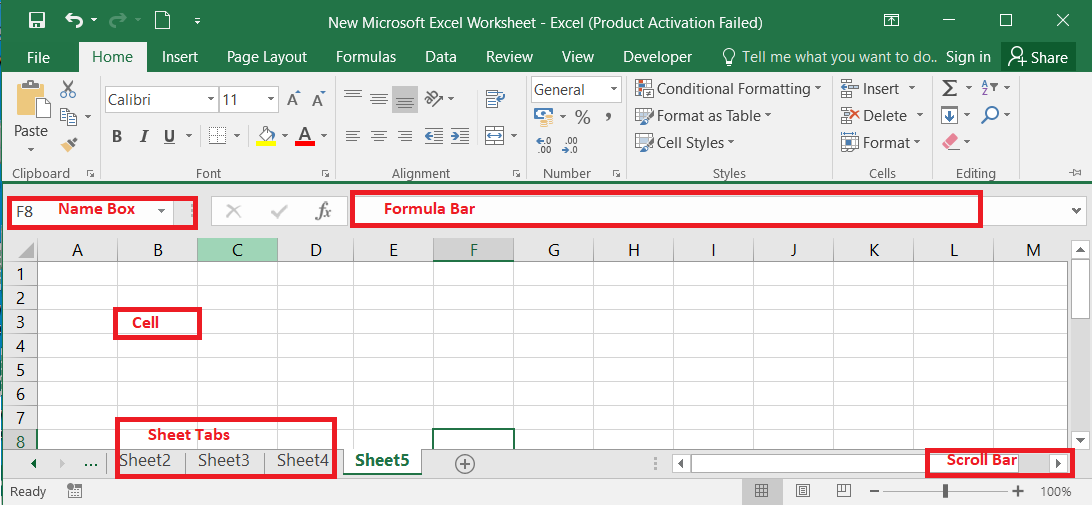
Parts of the Excel Window
Before you start using it, it’s really important to understand what is where in the window. Some parts of the Excel window (like the Ribbon and Scroll bars) are standard in most Microsoft programs. However, there are other features that are more specific to spreadsheets, such as the formula bar, name box, and worksheet tabs.
What are Workbooks?
A collection of worksheets is referred to as a workbook (spreadsheet). Workbooks are your Excel files. There are various ways to begin working with an Excel workbook. Excel files are called workbooks. There are various ways to begin working with an Excel workbook. You can either start from scratch or use a pre-designed template to create a new workbook.
Creating and Opening Workbooks
Steps to Create a new blank workbook:
Step 1: Select the File tab
Step 2: Click New
Step 3: Click Blank Workbook
Step 4: A new blank workbook will appear.
You can also use Templates. A template is a predesigned spreadsheet you can use to create a new workbook quickly. Templates often include custom formatting and predefined formulas.
Saving Workbook
Whenever we create a new workbook in Excel and insert the data into it, then we must save our workbook so that our data is not lost. As in previous versions of Excel, you can save files locally to your computer You can also save your workbook to the cloud and also export your workbook with others.
Save: When you save a file, you’ll only need to choose a file name and location the first time. Then you can just use the save command to save it with the same name and location.
Save As: When you use Save As, you’ll need to choose a different name and /or location for the copied version.
Excel automatically saves your workbooks to a temporary folder while you are working on them. If you forget to save your changes or if Excel crashes, you can restore the file using AutoRecover.
What are Worksheets in Excel?
A Worksheet is a collection of cells(basic data unit in the worksheet). Where you can store and manipulate data. Adding information to multiple worksheets simultaneously is also easily accomplished by grouping worksheets. In Excel, Worksheets can be easily added, renamed, and deleted.
Working with Worksheets
When you open an Excel Workbook, there are three sheets by default and the name on them is sheet1, sheet2, and sheet3 you can change the name. You can perform multiple functions in Worksheets such as View a Worksheet, Select a Worksheet, Insert a Worksheet, Rename a Worksheet, and Delete a Worksheet.
Modifying Columns, Rows, and Cells
Every row and column of a new workbook is set with the same height and width. Excel allows you to modify column width and row height in different ways including wrapping text and merging cells.
Inserting, Deleting, Moving, and Hiding
After working with a workbook for a while, you may want to Insert new columns or rows, Delete certain rows and columns, Move them to a different location in the worksheet, or even Hide them.
You can easily search your workbook using the Find feature, which also allows you to modify using the Replace feature.
Excel includes a Spell-check tool that ensures everything is spelled correctly in your workbook.
All cell content uses the same Formatting by default, which can make it difficult to read a workbook with a lot of information. Data Formatting can be used to Change the font size, To change the font, To change the font color, and many more.
The most important and useful feature of Microsoft Excel is to Calculate numerical information using formulas. Excel can perform different calculations using mathematical operators (Addition, Subtraction, Multiplication, Division) We can Insert a formula, Create a Formula, and Edit a Formula. Also, values can be modified on the basis of Cell References.
What are Functions?
A function is a predefined formula that is used to perform calculations using specific values in a sequence. Excel has many common functions that can be used to quickly find the Sum, Average, Count, Maximum Value, and Minimum Value of a range of cells.
Basic Tips For Working with Data
Excel Workbooks are designed to store a lot of information no matter you are working with 10 cells or 10,000 cells. Excel has many features to help you Organize your data and Find what you need.
Sometimes you may want to see certain rows and columns all the time in your worksheet, mainly Header cells. By freezing rows and Columns in place, you’ll able to scroll through your content.
1. Sorting Data
You can quickly reorganize your data in a sequence you want in your worksheet by sorting your data. You can sort your data alphabetically, numerically, and in many other ways.
2. Filtering Data
Filters can be applied to data in your worksheet allowing you to view only the information you need. Formatting Data as a Table can improve the overall look of your workbook and help you to organize your content and make your data easier to use.
3. Groups and Subtotals
Worksheets with a lot of content can sometimes feel overwhelming. Excel provides you with the feature of organizing data into Groups, allowing you to easily show and hide different sections of your worksheet. The Subtotal command allows you to quickly summarize data. Below are some functions that you can learn in Groups and subtotal.
- To group rows or columns
- To hide and show groups
Tables
After entering your data in the worksheet, you may want to format your data as a table. They will help to organize your data content and make your data easier to use and understand. Excel has many predefined table styles, allowing you to create tables quickly and easily.
Formatting Data as a Table
Step 1: Select the Cells you want to format as a table
Step 2: Click the Format as Table in the styles group from the Home tab
Step 3: Now select Table Style from the drop-down menu
Step 4: Confirm the cell range for the table
Step 5: Click OK if your table has headers
Step 6: The cell range will be formatted in the selected table style.
Modifying Tables
It is easy to modify the look of the table after adding it to a worksheet. Excel includes several options for customizing a table, including adding rows or columns, changing the table style, Modifying the table style options, and removing a table.
What are Charts?
It is difficult to examine Excel workbooks that contain a lot of data. Charts help you to illustrate your workbook data graphically, which makes it easy to examine and compare the Excel workbook and make better decisions.
You can learn how to insert and modify Excel Charts to visualize comparisons in your data. There are many options to change the chart and layout style.
Similar to charts Conditional formatting provides a way to visualize data and make worksheets easier to understand. It allows you to automatically apply formattings- such as formattings, and data bars to one or more cells. You can use Conditional formatting by using the below steps.
How to use Conditional Formatting in Excel
Step 1: Select desired cells
Step 2: Click on the Conditional formatting command from the Home Tab
Step 3: Select the desired rule from the menu that appears
Step 4: Enter the desired values in the dialog box
Step 5: Select Formatting styles.
You can also use Conditional Formatting presets and Remove the Conditional Formatting.
What are Pivot Tables?
If your workbook contains lots of data, it can sometimes be difficult to analyze all the information in your worksheet. PivotTables can help to make worksheets more manageable by summarizing data and allowing you to manipulate it in different ways.
How to Create Pivot Tables
Step1: Select the Create or cells
Step 2: From the Insert tab click on the PivotTable
Step 3: Choose your settings in the Create PivotTable Dialog box and click ok
Step 4: A blank PivotTable and Field List will appear in a new worksheet.
What are Macros?
Macro allows automating repetitive tasks in Microsoft Excel. Some tasks need to be performed multiple times and repetition of all actions would consume time. In these scenarios, Macros help in automating these tasks. A Macro is the set of actions that we run as many times as required to perform a particular task. When the macro is Created, the whole mouse clicks, and the keystrokes get recorded.
You can learn how to Enable a Macro, How to Record a Macro, and How to Run a Macro in different ways.
What is VBA?
VBA stands for Visual Basic application is a readable and editable programming code that gets generated when the macro is recorded. It is now used with Microsoft Office applications such as MS Excel, MS Word, and MS- Access. With VBA, you can refer to the Excel Objects and use the properties, methods, and events associated with them.
Comments and Co-authoring
These are the two most powerful features that allow you to work with others on the same spreadsheet: Comments and Co-authoring these features come in the role when you’re working on a workbook and find that you need the help of others.
The Track Changes feature can also be helpful to review changes before making them permanent. It’s still available in Office 365, but it’s now Hidden by default.
Inspecting and Protecting Workbooks
While sharing a workbook in Excel, everyone wants to make sure it doesn’t include any spelling errors or information you want to keep private. Excel includes several tools to help finalize and protect your workbook, including Document Inspector and Protect Workbook Feature.
What-if Analysis
This feature can help you experiment and answer questions with your data, even when the data is incomplete. To learn how to use the What -if- analysis, use a tool called Goal Seek.
New Features in Office 2019
Office 2019 was released in September 2018, If you have used 2016 or earlier versions, you will probably find Office 2019 familiar. The interface is similar and most of the features still work the same. There are a couple of new chart types in Excel: Map charts and Funnel charts.
Dynamic Map with Drop-Down in Excel
How to Create Dynamic Excel Dashboards Using Picklists?
What are Reference Styles?
Every Excel spreadsheet contains rows and columns. Most of the time columns are denoted by letters (A, B, C) and rows are denoted by numbers(1, 2, 3). This is known as the A1 reference style.
Whether you use a digital pen, touchscreen, or mouse, the drawing feature in the office can help you to add notes, create shapes, edit text, and more.
If you need graphics for the project, there is a feature you can use called icons. Icons are a library of modern, professional graphics included with Office 365 and 2019, and they can be customized to fit your needs.
Power View
Power View is the data visualization technology that lets you create interactive charts, graphs, maps, and other various visuals. Power View enables interactive data exploration that encourages intuitive ad-hoc reporting. Power view is completely based on the Data model in your workbook. There are various functions and operations to be performed on Power View listed below.
Power Pivot
It is an Excel add-in that can be used to perform better data analysis and create sophisticated data models. With Power Pivot, you can work on large volumes of data from different sources, and perform information analysis effectively. When you have multiple tables, Power Pivot can help you to link them together. After linking them together you can create a Pivot table that will help you to view the data in a single table.
Advanced Excel
Advanced Excel provides a good insight into the latest and advanced features available in Microsoft Excel.
Power Query
It is a tool available in Excel that helps you to import data from many different sources and then clean, transform and reshape the data as required. You need to set up a query once and then reuse it with a simple refresh. The query can import millions of rows into the data model for analysis.
Microsoft Excel Keyboard Shortcuts
Knowing keyboard shortcuts can significantly speed up your Excel workflow. Here are a few commonly used shortcuts:
- Ctrl + C: Copy selected cells
- Ctrl + V: Paste copied cells
- Ctrl + Z: Undo the last action
- Ctrl + S: Save the workbook
- Ctrl + F: Open the Find dialog box
- Ctrl + B: Apply bold formatting
- Ctrl + Shift + L: Apply filters to a table
More MS Excel Keybord Shortcuts – Excel Keybord Shortcuts
FAQs on MS-Excel
Q1: What are the benefits of using MS Excel?
The main benefit of using MS-Excel are:
- The MS-Excel is best way to store a huge amount of data.
- You can perform different Calculations.
- There are several tools that are available for Data analysis
- You can print reports easily.
- You can automate your code easily .
- You can Transform your data.
- It’s easy to reformat and rearrange your data.
- Process data and analysed with graphs and charts
Q2: What are the shortcut keys of MS Excel?
Shortcut Keys are used for navigating and working with Excel spreadsheets with speed. The main shortcut keys of MS-Excel are:-
- Key to open a workbook (Ctrl+N)
- Key to open a saved workbook(Ctrl+O)
- Key to save a workbook(Ctrl+S)
- Key to copy the selected cells(Ctrl+C)
- Key taste the copied cells(Ctrl+V)
- Key to cut the selected cells(Ctrl+X)
- Key to close the workbook(Ctrl+W)
- Key to remove all the contents from the cell(Delete)
- Key to print the workbook(Ctrl+P)
- Key to undo(Ctrl+Z)
Q3: Is MS Excel an Operating system?
MS-Excel is not an operating system. It is a spreadsheet program included in the Microsoft Office suite of several applications. It is introduced by Microsoft and it is developed for Windows, Android, macOS, and iOS users.
Q4: What do you mean by Cell address?
Cell address refers to the address that is obtained by the combination of the row number and column alphabet. Every celll has a distinct cell address.
Q5: How can you protect your workbooks in Excel?
To protect your workbook below are three ways:
- Set a password to open the workbook.
- Protect the sheet from being added, deleted, hidden, or unhidden.
- Protecting window sizes or positions from being changed.
Like Article
Suggest improvement
Share your thoughts in the comments
Please Login to comment...