Class 11 NCERT Solutions – Chapter 6 Linear Inequalities – Exercise 6.2
Last Updated :
03 Mar, 2021
Solve the following inequalities graphically in two-dimensional plane:
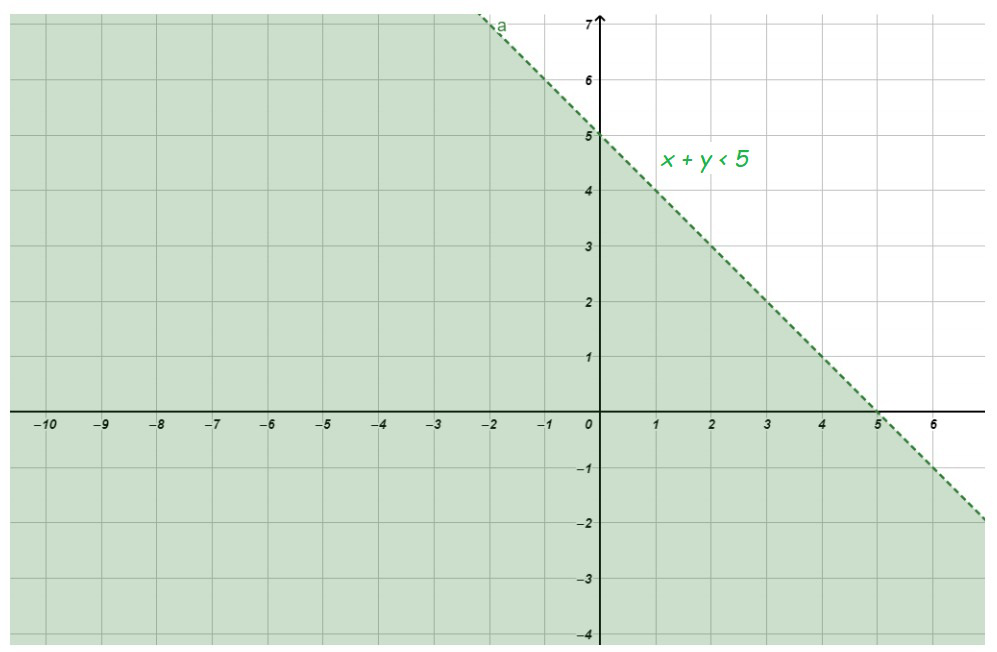
Question 1: x + y < 5
Solution:
Now draw a dotted line x + y = 5 in the graph (because (x + y = 5) is NOT the part of the given equation)
We need at least two solutions of the equation. So, we can use the following table to draw the graph:
Consider x + y < 5
Lets, select origin point (0, 0)
⇒ 0 + 0 < 5
⇒ 0 < 5 (this is true)
Hence, Solution region of the given inequality is the line x + y = 5. where, Origin is included in the region
The graph is as follows:
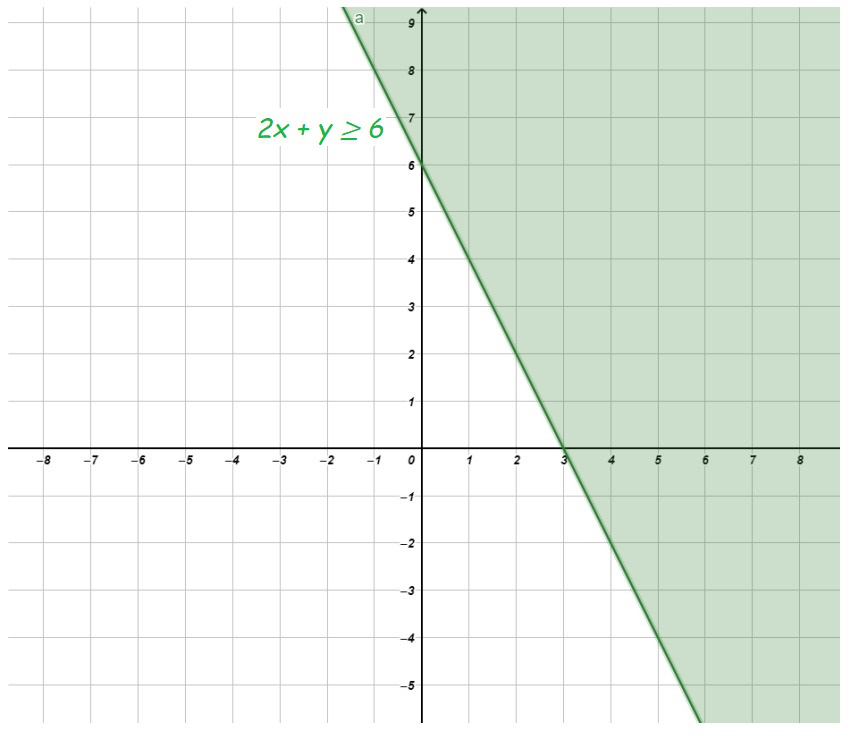
Question 2: 2x + y ≥ 6
Solution:
Now draw a solid line 2x + y = 6 in the graph (because (2x + y = 6) is the part of the given equation)
We need at least two solutions of the equation. So, we can use the following table to draw the graph:
Consider 2x + y ≥ 6
Lets, select origin point (0, 0)
⇒ 0 + 0 ≥ 6
⇒ 0 ≥ 6 (this is not true)
Hence, Solution region of the given inequality is the line 2x + y ≥ 6. where, Origin is not included in the region
The graph is as follows:
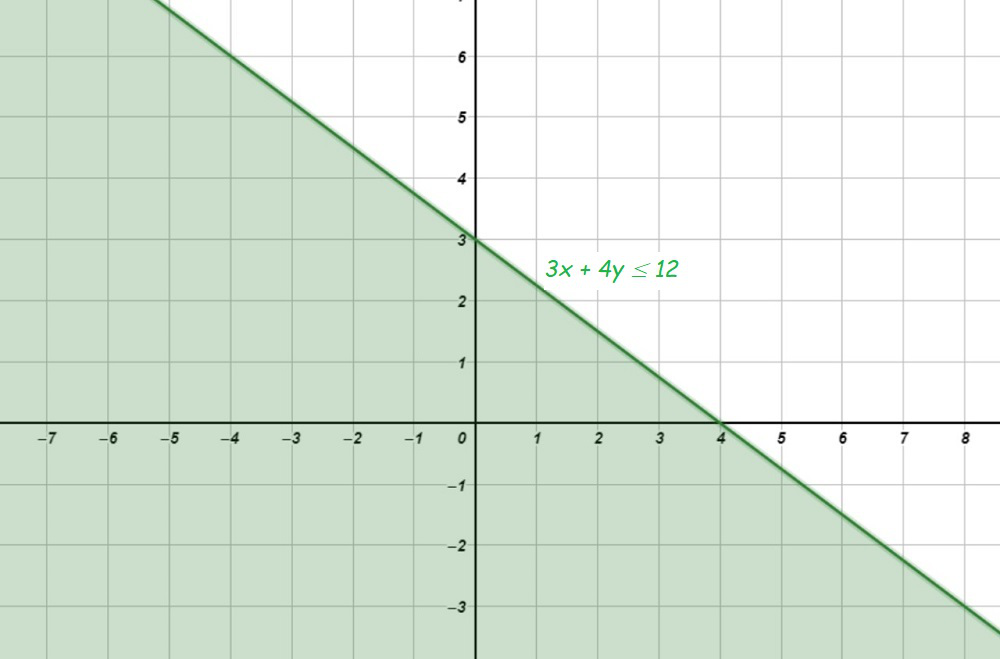
Question 3: 3x + 4y ≤ 12
Solution:
Now draw a solid line 3x + 4y = 12 in the graph (because (3x + 4y = 12) is the part of the given equation)
We need at least two solutions of the equation. So, we can use the following table to draw the graph:
Consider 3x + 4y ≤ 12
Lets, select origin point (0, 0)
⇒ 0 + 0 ≤ 12
⇒ 0 ≤ 12 (this is true)
Hence, Solution region of the given inequality is the line 3x + 4y ≤ 12. where, Origin is included in the region
The graph is as follows:
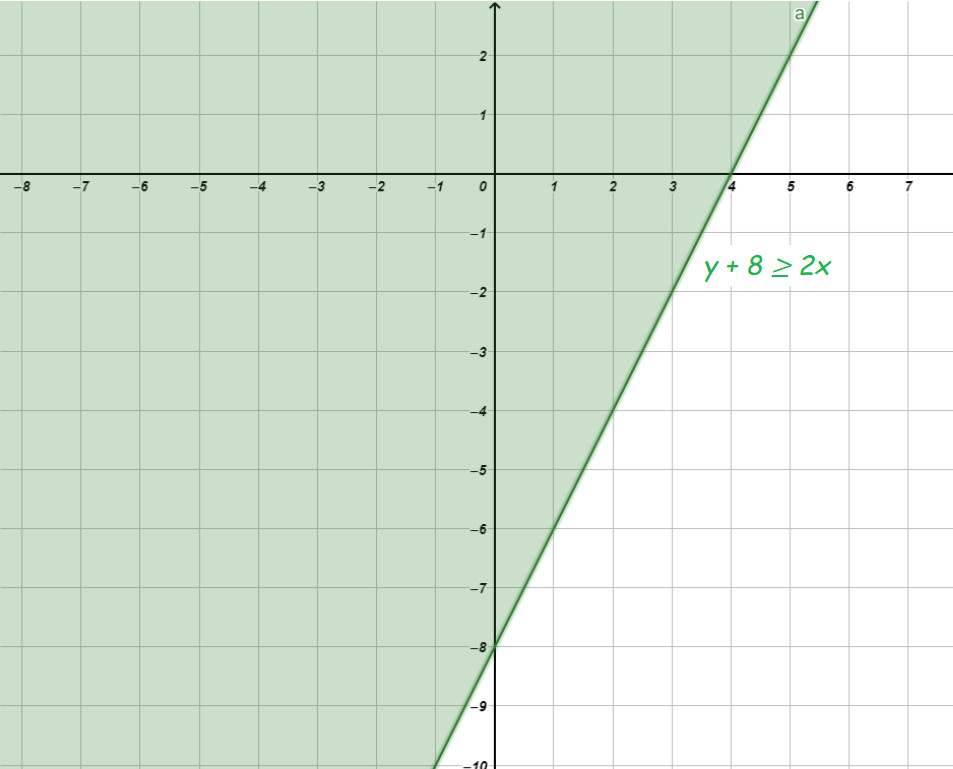
Question 4: y + 8 ≥ 2x
Solution:
Now draw a solid line y + 8 = 2x in the graph (because (y + 8 = 2x) is the part of the given equation)
We need at least two solutions of the equation. So, we can use the following table to draw the graph:
Consider y + 8 ≥ 2x
Lets, select origin point (0, 0)
⇒ 0 + 8 ≥ 0
⇒ 8 ≥ 0 (this is true)
Hence, Solution region of the given inequality is the line y + 8 ≥ 2x. where, Origin is included in the region
The graph is as follows:
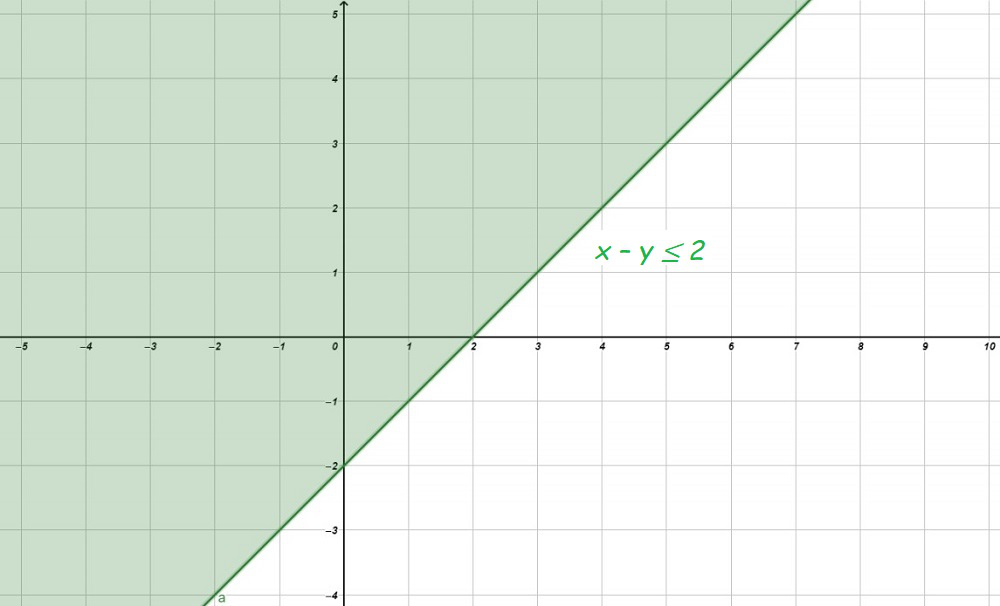
Question 5: x – y ≤ 2
Solution:
Now draw a solid line x – y = 2 in the graph (because (x – y = 2) is the part of the given equation)
We need at least two solutions of the equation. So, we can use the following table to draw the graph:
Consider x – y ≤ 2
Lets, select origin point (0, 0)
⇒ 0 – 0 ≤ 2
⇒ 0 ≤ 2 (this is true)
Hence, Solution region of the given inequality is the line x – y ≤ 2. where Origin is included in the region
The graph is as follows:
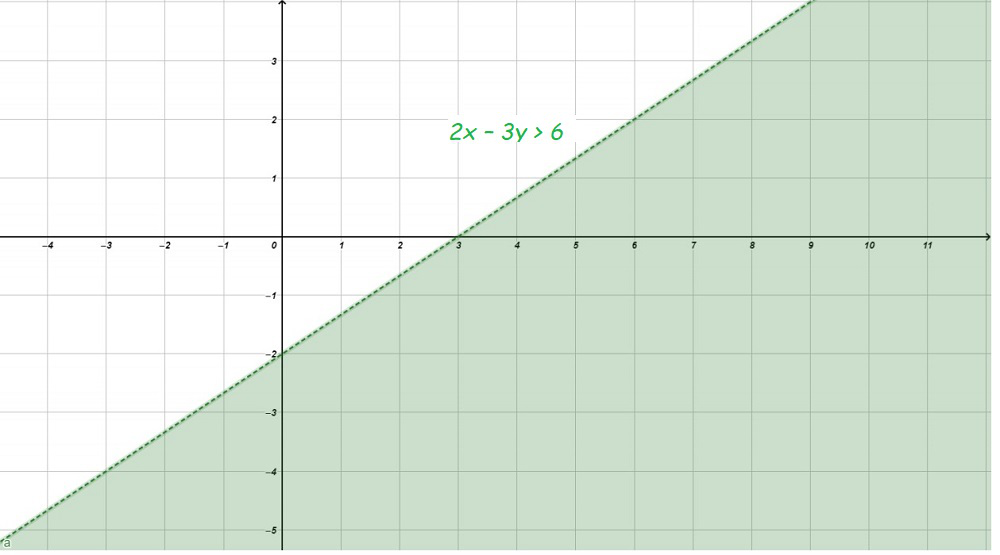
Question 6: 2x – 3y > 6
Solution:
Now draw a dotted line 2x – 3y = 6 in the graph (because (2x – 3y = 6) is NOT the part of the given equation)
We need at least two solutions of the equation. So, we can use the following table to draw the graph:
Consider 2x – 3y > 6
Lets, select origin point (0, 0)
⇒ 0 + 0 > 6
⇒ 0 > 6 (this is not true)
Hence, Solution region of the given inequality is the line 2x – 3y > 6. where, Origin is not included in the region
The graph is as follows:
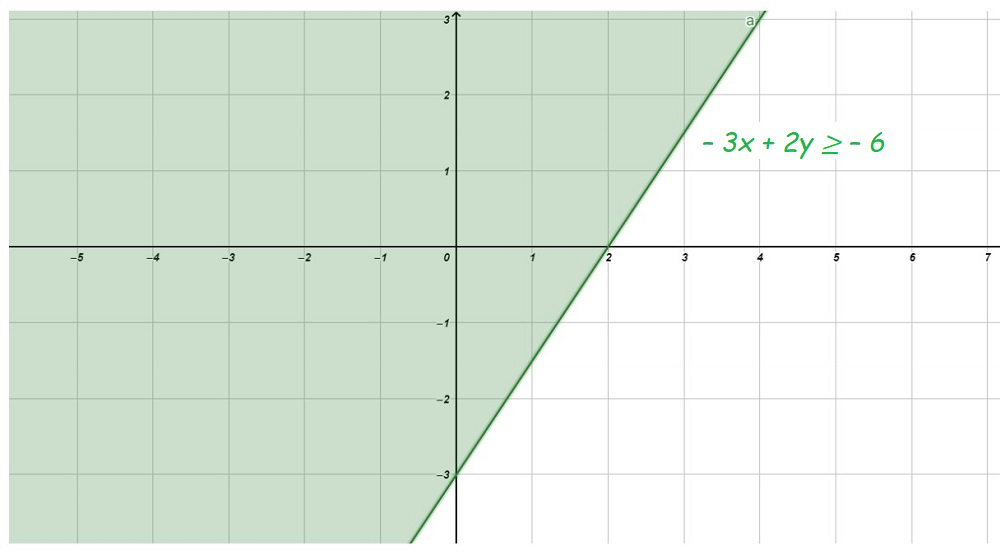
Question 7: – 3x + 2y ≥ – 6
Solution:
Now draw a solid line – 3x + 2y = – 6 in the graph (because (– 3x + 2y = – 6) is the part of the given equation)
We need at least two solutions of the equation. So, we can use the following table to draw the graph:
Consider – 3x + 2y ≥ – 6
Lets, select origin point (0, 0)
⇒ 0 + 0 ≥ – 6
⇒ 0 ≥ – 6 (this is true)
Hence, Solution region of the given inequality is the line – 3x + 2y ≥ – 6. where, Origin is included in the region
The graph is as follows:
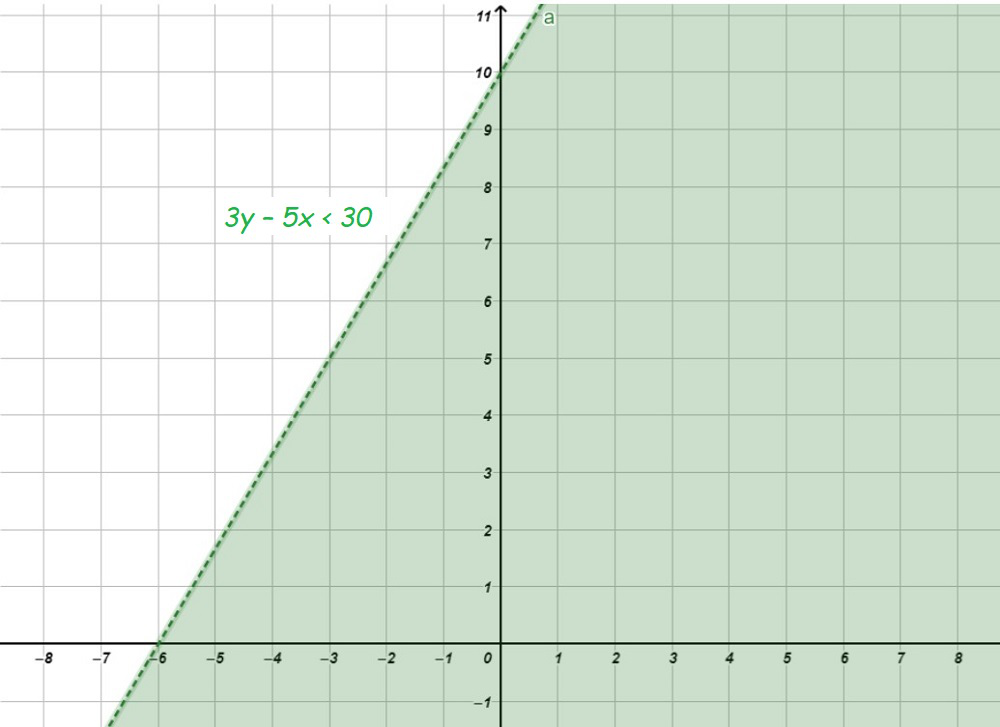
Question 8: 3y – 5x < 30
Solution:
Now draw a dotted line 3y – 5x = 30 in the graph (because (3y – 5x = 30) is NOT the part of the given equation)
We need at least two solutions of the equation. So, we can use the following table to draw the graph:
Consider 3y – 5x < 30
Lets, select origin point (0, 0)
⇒ 0 + 0 < 30
⇒ 0 < 30 (this is true)
Hence, Solution region of the given inequality is the line 3y – 5x < 30. where, Origin is included in the region
The graph is as follows:
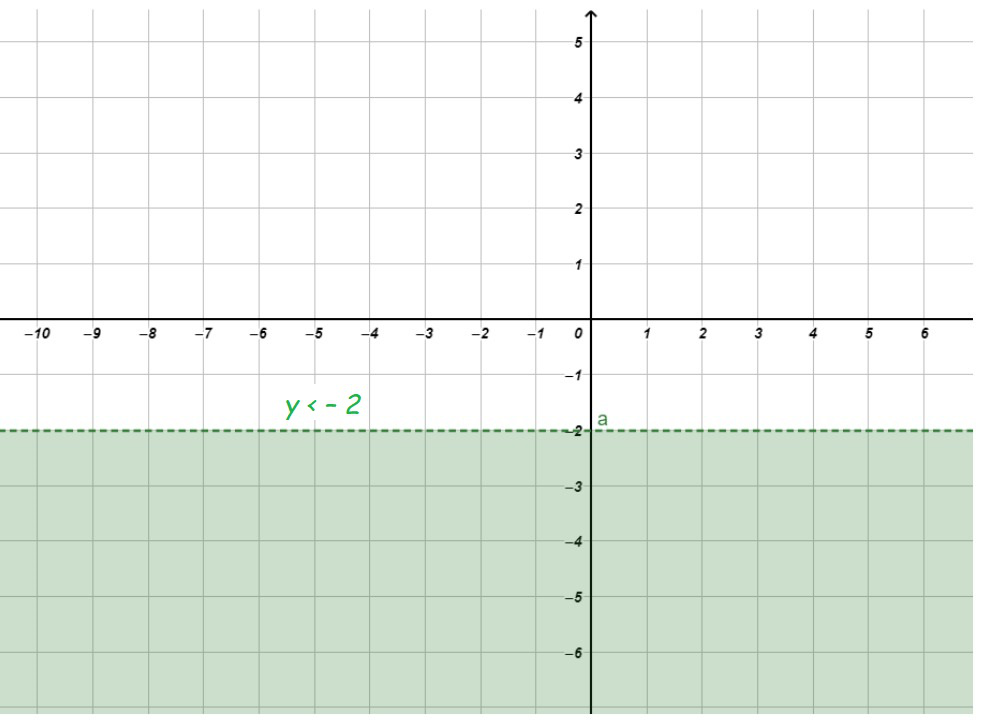
Question 9: y < – 2
Solution:
Now draw a dotted line y = – 2 in the graph (because (y = – 2) is NOT the part of the given equation)
we need at least two solutions of the equation. So, we can use the following table to draw the graph:
Consider y < – 2
Lets, select origin point (0, 0)
⇒ 0 < – 2
⇒ 0 < – 2 (this is not true)
Hence, Solution region of the given inequality is the line y < – 2. where, Origin is not included in the region
The graph is as follows:
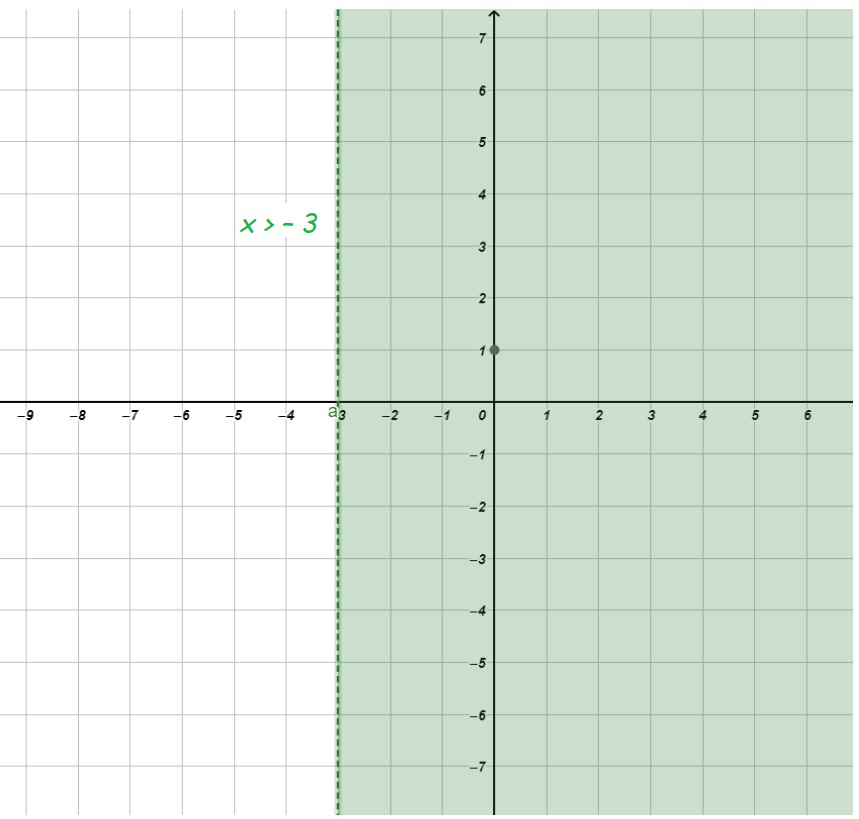
Question 10: x > – 3
Solution:
Now draw a dotted line x = – 3 in the graph (because (x = – 3) is NOT the part of the given equation)
we need at least two solutions of the equation. So, we can use the following table to draw the graph:
Consider x > – 3
Lets, select origin point (0, 0)
⇒ 0 > – 3
⇒ 0 > – 3 (this is true)
Hence, Solution region of the given inequality is the line x > – 3. where, Origin is included in the region
The graph is as follows:
Share your thoughts in the comments
Please Login to comment...