You all must have worked with Excel at some time in your life and must have felt the need to automate some repetitive or tedious task. Don’t worry in this tutorial we are going to learn about how to work with Excel using Python, or automating Excel using Python. We will be covering this with the help of the Openpyxl module and will also see how to get Python in Excel.
Getting Started Python Openpyxl
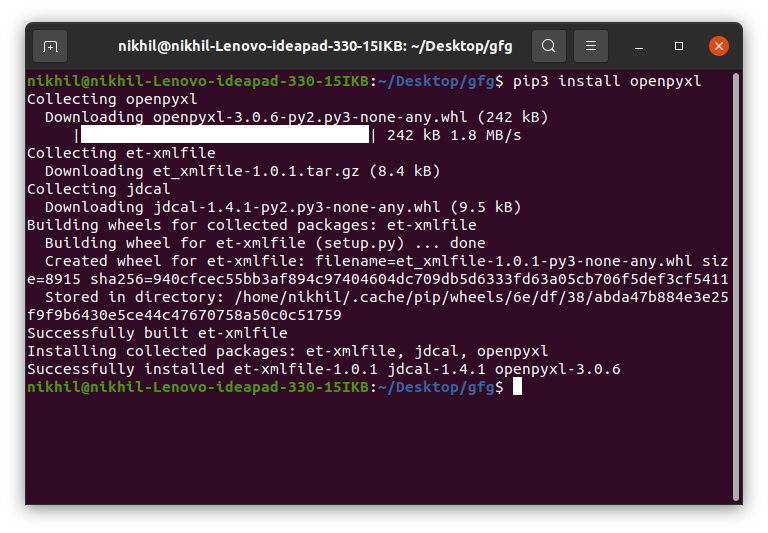
Openpyxl is a Python library that provides various methods to interact with Excel Files using Python. It allows operations like reading, writing, arithmetic operations, plotting graphs, etc. This module does not come in-built with Python. To install this type the below command in the terminal.
pip install openpyxl
Read an Excel File in Python
To read an Excel file you have to open the spreadsheet using the load_workbook() method. After that, you can use the active to select the first sheet available and the cell attribute to select the cell by passing the row and column parameter. The value attribute prints the value of the particular cell. See the below example to get a better understanding.
Note: The first row or column integer is 1, not 0.
Example:
In this example, a Python program uses the openpyxl module to read an Excel file (“gfg.xlsx”), opens the workbook, and retrieves the value of the cell in the first row and first column, printing it to the console.
Python3
import openpyxl
path = "gfg.xlsx"
wb_obj = openpyxl.load_workbook(path)
sheet_obj = wb_obj.active
cell_obj = sheet_obj.cell(row=1, column=1)
print(cell_obj.value)
|
Output:
Name
Python Openpyxl Read multiple cells
There can be two ways of reading from multiple cells:
- Reading through Rows and Columns in Excel with openpyxl
- Read from multiple cells using the cell name
Reading through Rows and Columns in Excel with openpyxl
We can get the count of the total rows and columns using the max_row and max_column respectively. We can use these values inside the for loop to get the value of the desired row or column or any cell depending upon the situation. Let’s see how to get the value of the first column and first row.
In this example, a Python program using the openpyxl module reads an Excel file (“gfg.xlsx”). It retrieves and prints the total number of rows and columns in the active sheet, followed by displaying the values of the first column and first row through iterative loops.
Python3
import openpyxl
path = "gfg.xlsx"
wb_obj = openpyxl.load_workbook(path)
sheet_obj = wb_obj.active
row = sheet_obj.max_row
column = sheet_obj.max_column
print("Total Rows:", row)
print("Total Columns:", column)
print("\nValue of first column")
for i in range(1, row + 1):
cell_obj = sheet_obj.cell(row=i, column=1)
print(cell_obj.value)
print("\nValue of first row")
for i in range(1, column + 1):
cell_obj = sheet_obj.cell(row=2, column=i)
print(cell_obj.value, end=" ")
|
Output:
Total Rows: 6
Total Columns: 4
Value of first column
Name
Ankit
Rahul
Priya
Nikhil
Nisha
Value of first row
Ankit  B.Tech CSE 4
Read from Multiple Cells Using the Cell Name
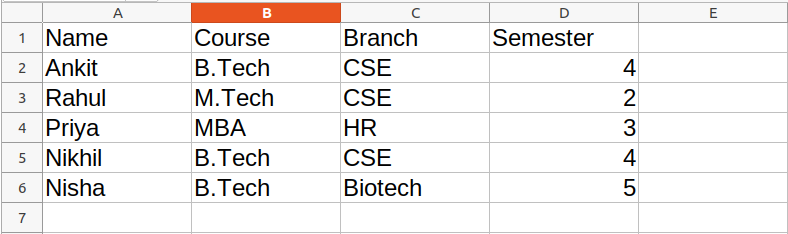
We can also read from multiple cells using the cell name. This can be seen as the list slicing of Python. In this example, a Python program utilizes the openpyxl module to read an Excel file (“gfg.xlsx”). It creates a cell object by specifying a range from ‘A1’ to ‘B6’ in the active sheet and prints the values of each cell pair within that range using a for loop.
Python3
import openpyxl
path = "gfg.xlsx"
wb_obj = openpyxl.load_workbook(path)
sheet_obj = wb_obj.active
cell_obj = sheet_obj['A1': 'B6']
for cell1, cell2 in cell_obj:
print(cell1.value, cell2.value)
|
Output:
Name Course
Ankit  B.Tech
Rahul M.Tech
Priya MBA
Nikhil B.Tech
Nisha B.Tech
Refer to the below article to get detailed information about reading excel files using openpyxl.
Python Write Excel File
First, let’s create a new spreadsheet, and then we will write some data to the newly created file. An empty spreadsheet can be created using the Workbook() method. Let’s see the below example.
Example:
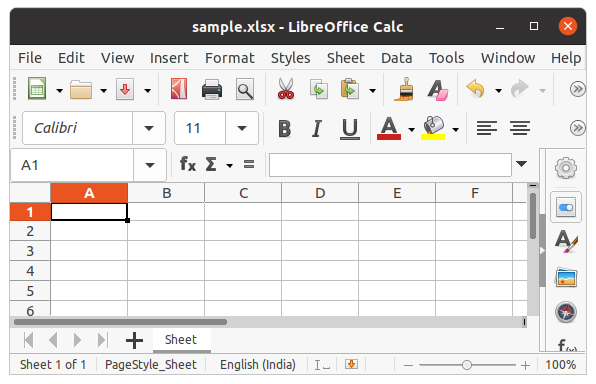
In this example, a new blank Excel workbook is generated using the openpyxl library’s Workbook() function, and it is saved as “sample.xlsx” with the save() method. This code demonstrates the fundamental steps for creating and saving an Excel file in Python.
Python3
from openpyxl import Workbook
workbook = Workbook()
workbook.save(filename="sample.xlsx")
|
Output:
After creating an empty file, let’s see how to add some data to it using Python. To add data first we need to select the active sheet and then using the cell() method we can select any particular cell by passing the row and column number as its parameter. We can also write using cell names. See the below example for a better understanding.
Example:
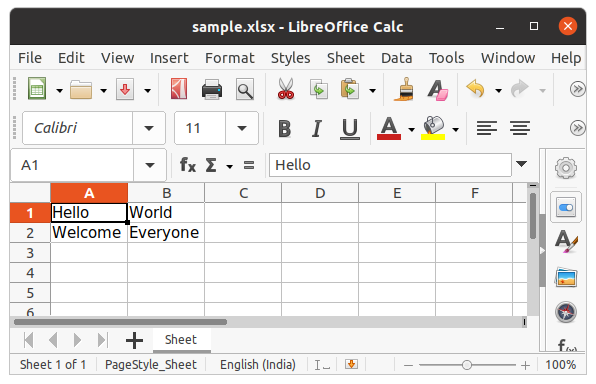
In this example, the openpyxl module is used to create a new Excel workbook and populate cells with values such as “Hello,” “World,” “Welcome,” and “Everyone.” The workbook is then saved as “sample.xlsx,” illustrating the process of writing data to specific cells and saving the changes
Python3
import openpyxl
wb = openpyxl.Workbook()
sheet = wb.active
c1 = sheet.cell(row=1, column=1)
c1.value = "Hello"
c2 = sheet.cell(row=1, column=2)
c2.value = "World"
c3 = sheet['A2']
c3.value = "Welcome"
c4 = sheet['B2']
c4.value = "Everyone"
wb.save("sample.xlsx")
|
Output:
Refer to the below article to get detailed information about writing to excel.
Append data in excel using Python
In the above example, you will see that every time you try to write to a spreadsheet the existing data gets overwritten, and the file is saved as a new file. This happens because the Workbook() method always creates a new workbook file object. To write to an existing workbook you must open the file with the load_workbook() method. We will use the above-created workbook.
Example:
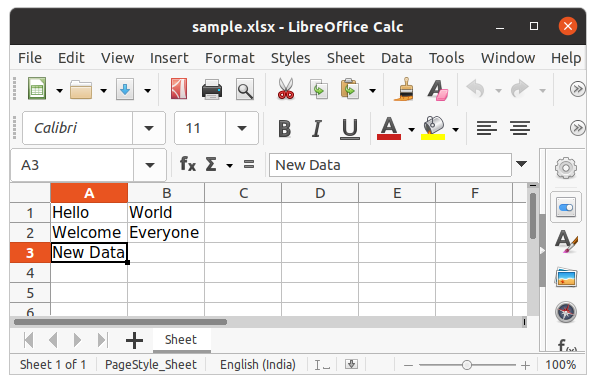
In this example, the openpyxl module is employed to load an existing Excel workbook (“sample.xlsx”). The program accesses cell ‘A3’ in the active sheet, updates its value to “New Data,” and then saves the modified workbook back to “sample.xlsx.”
Python3
import openpyxl
wb = openpyxl.load_workbook("sample.xlsx")
sheet = wb.active
c = sheet['A3']
c.value = "New Data"
wb.save("sample.xlsx")
|
Output:
We can also use the append() method to append multiple data at the end of the sheet.
Example:
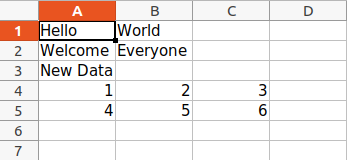
In this example, the openpyxl module is utilized to load an existing Excel workbook (“sample.xlsx”). A two-dimensional data structure (tuple of tuples) is defined and iteratively appended to the active sheet, effectively adding rows with values (1, 2, 3) and (4, 5, 6).
Python3
import openpyxl
wb = openpyxl.load_workbook("sample.xlsx")
sheet = wb.active
data = (
(1, 2, 3),
(4, 5, 6)
)
for row in data:
sheet.append(row)
wb.save('sample.xlsx')
|
Output:
Arithmetic Operation on Spreadsheet
Arithmetic operations can be performed by typing the formula in a particular cell of the spreadsheet. For example, if we want to find the sum then =Sum() formula of the excel file is used.
Example:
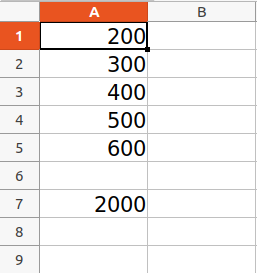
In this example, the openpyxl module is used to create a new Excel workbook and populate cells A1 to A5 with numeric values. Cell A7 is assigned a formula to calculate the sum of the values in A1 to A5.
Python3
import openpyxl
wb = openpyxl.Workbook()
sheet = wb.active
sheet['A1'] = 200
sheet['A2'] = 300
sheet['A3'] = 400
sheet['A4'] = 500
sheet['A5'] = 600
sheet['A7'] = '= SUM(A1:A5)'
wb.save("sum.xlsx")
|
Output:
Refer to the below article to get detailed information about the Arithmetic operations on Spreadsheet.
Adjusting Rows and Column
Worksheet objects have row_dimensions and column_dimensions attributes that control row heights and column widths. A sheet’s row_dimensions and column_dimensions are dictionary-like values; row_dimensions contains RowDimension objects and column_dimensions contains ColumnDimension objects. In row_dimensions, one can access one of the objects using the number of the row (in this case, 1 or 2). In column_dimensions, one can access one of the objects using the letter of the column (in this case, A or B).
Example:
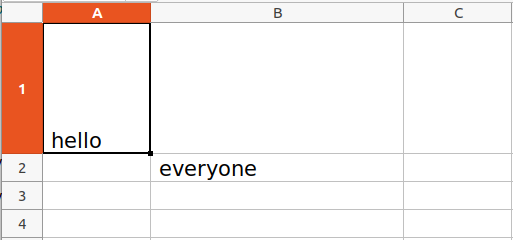
In this example, the openpyxl module is used to create a new Excel workbook and set values in specific cells. The content “hello” is placed in cell A1, and “everyone” is placed in cell B2. Additionally, the height of the first row is set to 70 units, and the width of column B is set to 20 units.
Python3
import openpyxl
wb = openpyxl.Workbook()
sheet = wb.active
sheet.cell(row=1, column=1).value = ' hello '
sheet.cell(row=2, column=2).value = ' everyone '
sheet.row_dimensions[1].height = 70
sheet.column_dimensions['B'].width = 20
wb.save('sample.xlsx')
|
Output:
Merging Cells
A rectangular area of cells can be merged into a single cell with the merge_cells() sheet method. The argument to merge_cells() is a single string of the top-left and bottom-right cells of the rectangular area to be merged.
Example:
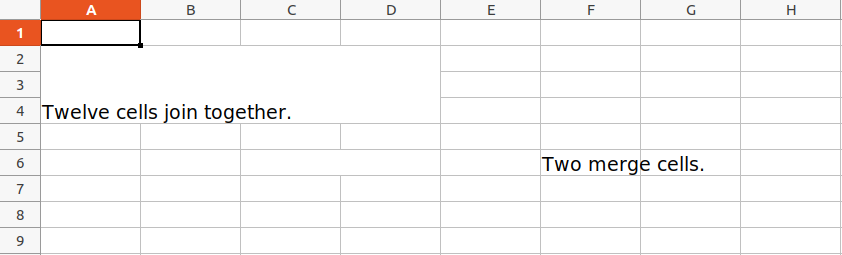
In this example, the openpyxl module is employed to create a new Excel workbook. The program merges cells A2 to D4, creating a single cell spanning multiple columns and rows, and sets its value to ‘Twelve cells join together.’ Additionally, cells C6 and D6 are merged, and the text ‘Two merge cells.’ is placed in the resulting merged cell.
Python3
import openpyxl
wb = openpyxl.Workbook()
sheet = wb.active
sheet.merge_cells('A2:D4')
sheet.cell(row=2, column=1).value = 'Twelve cells join together.'
sheet.merge_cells('C6:D6')
sheet.cell(row=6, column=6).value = 'Two merge cells.'
wb.save('sample.xlsx')
|
Output:
Unmerging Cells
To unmerge cells, call the unmerge_cells() sheet method.
Example:
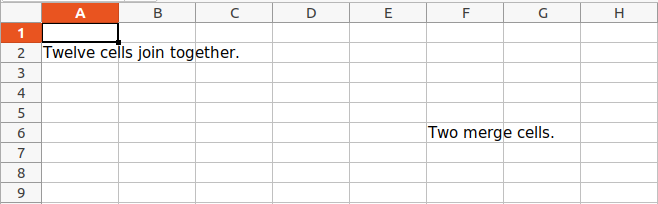
In this example, the openpyxl module is used to load an existing Excel workbook (“sample.xlsx”). The program then unmerges previously merged cells, specifically cells A2 to D4 and cells C6 to D6.
Python3
import openpyxl
wb = openpyxl.load_workbook('sample.xlsx')
sheet = wb.active
sheet.unmerge_cells('A2:D4')
sheet.unmerge_cells('C6:D6')
wb.save('sample.xlsx')
|
Output:
Setting Font Style
To customize font styles in cells, important, import the Font() function from the openpyxl.styles module.
Example:
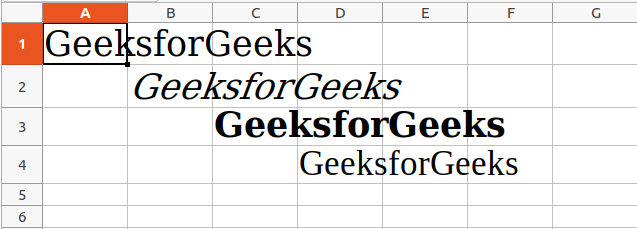
In this example, the openpyxl module is used to create a new Excel workbook. The program sets values in different cells with the text “GeeksforGeeks” and applies various font styles to each cell.
Python3
import openpyxl
from openpyxl.styles import Font
wb = openpyxl.Workbook()
sheet = wb.active
sheet.cell(row = 1, column = 1).value = "GeeksforGeeks"
sheet.cell(row = 1, column = 1).font = Font(size = 24 )
sheet.cell(row = 2, column = 2).value = "GeeksforGeeks"
sheet.cell(row = 2, column = 2).font = Font(size = 24, italic = True)
sheet.cell(row = 3, column = 3).value = "GeeksforGeeks"
sheet.cell(row = 3, column = 3).font = Font(size = 24, bold = True)
sheet.cell(row = 4, column = 4).value = "GeeksforGeeks"
sheet.cell(row = 4, column = 4).font = Font(size = 24, name = 'Times New Roman')
wb.save('sample.xlsx')
|
Output:
Refer to the below article to get detailed information about adjusting rows and columns.
Plotting Charts
Charts are composed of at least one series of one or more data points. Series themselves are comprised of references to cell ranges. For plotting the charts on an excel sheet, firstly, create chart objects of specific chart class( i.e BarChart, LineChart, etc.). After creating chart objects, insert data in it, and lastly, add that chart object in the sheet object.
Example 1: Creating and Customizing Bar Chart in Excel with openpyxl
In this example, the openpyxl module is used to create a new Excel workbook. Numeric values from 0 to 9 are written to the first column of the active sheet. A BarChart object is then created, and data for plotting is specified using the Reference class. The chart is customized with a title, x-axis title, and y-axis title. Finally, the chart is added to the sheet, anchored to cell E2.
Python3
import openpyxl
from openpyxl.chart import BarChart, Reference
wb = openpyxl.Workbook()
sheet = wb.active
for i in range(10):
sheet.append([i])
values = Reference(sheet, min_col=1, min_row=1,
max_col=1, max_row=10)
chart = BarChart()
chart.add_data(values)
chart.title = " BAR-CHART "
chart.x_axis.title = " X_AXIS "
chart.y_axis.title = " Y_AXIS "
sheet.add_chart(chart, "E2")
wb.save("sample.xlsx")
|
Output:

Example 2: Creating and Customizing Line Chart in Excel with openpyxl
In this example, the openpyxl module is used to create a new Excel workbook. Numeric values from 0 to 9 are written to the first column of the active sheet. A LineChart object is then created, and data for plotting is specified using the Reference class. The chart is customized with a title, x-axis title, and y-axis title. Finally, the chart is added to the sheet, anchored to cell E2.
Python3
import openpyxl
from openpyxl.chart import LineChart, Reference
wb = openpyxl.Workbook()
sheet = wb.active
for i in range(10):
sheet.append([i])
values = Reference(sheet, min_col=1, min_row=1,
max_col=1, max_row=10)
chart = LineChart()
chart.add_data(values)
chart.title = " LINE-CHART "
chart.x_axis.title = " X-AXIS "
chart.y_axis.title = " Y-AXIS "
sheet.add_chart(chart, "E2")
wb.save("sample.xlsx")
|
Output:

Refer to the below articles to get detailed information about plotting in excel using Python.
Adding Images
For the purpose of importing images inside our worksheet, we would be using openpyxl.drawing.image.Image. The method is a wrapper over PIL.Image method found in PIL (pillow) library. Due to which it is necessary for the PIL (pillow) library to be installed in order to use this method.
Image Used:

Example:
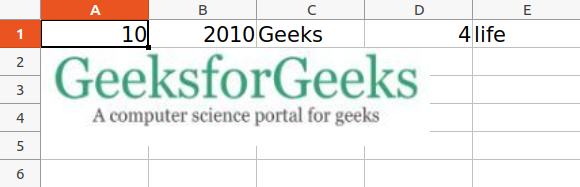
In this example, the openpyxl module is utilized to create a new Excel workbook. A row of data is added to the active sheet to distinguish it from the image. An image (“geek.jpg”) is then added to the worksheet using the openpyxl.drawing.image.Image class, and it is positioned at cell A2.
Python3
import openpyxl
from openpyxl.drawing.image import Image
wb = openpyxl.Workbook()
sheet = wb.active
sheet.append([10, 2010, "Geeks", 4, "life"])
img = Image("geek.jpg")
sheet.add_image(img, 'A2')
wb.save('sample.xlsx')
|
Output:
Refer to the below article to get detailed information about adding images.
Some More Functionality of Excel using Python
Share your thoughts in the comments
Please Login to comment...