Solve the following system of inequalities graphically:
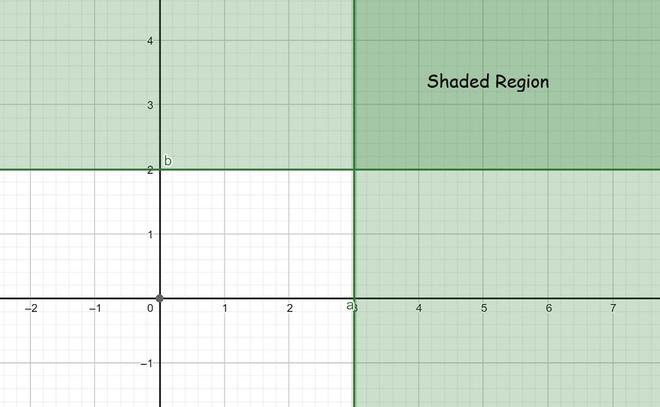
Question 1: x ≥ 3, y ≥ 2
Solution:
For equation 1:
Now draw a solid line x = 3 in the graph (because (x = 3) is the part of the given equation)
we need at least two solutions of the equation. So, we can use the following table to draw the graph:
Consider x ≥ 3
Lets, select origin point (0, 0)
⇒ 0 ≥ 3
⇒ 0 ≥ 3 (this not is true)
Hence, Solution region of the given inequality is the line x ≥ 3. where, Origin is not included in the region
For equation 2:
Now draw a solid line y = 2 in the graph (because (y = 2) is the part of the given equation)
we need at least two solutions of the equation. So, we can use the following table to draw the graph:
Consider y ≥ 2
Lets, select origin point (0, 0)
⇒ 0 ≥ 2
⇒ 0 ≥ 2 (this not is true)
Hence, Solution region of the given inequality is the line y ≥ 2. where, Origin is not included in the region
The graph will be as follows for Equation 1 and 2:
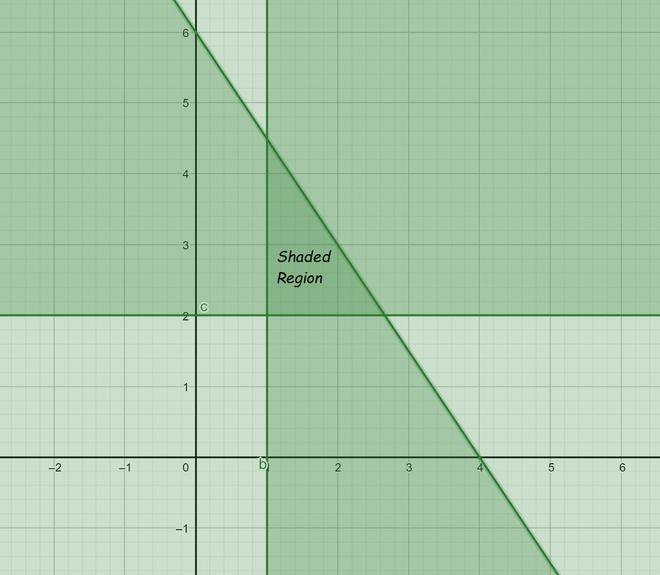
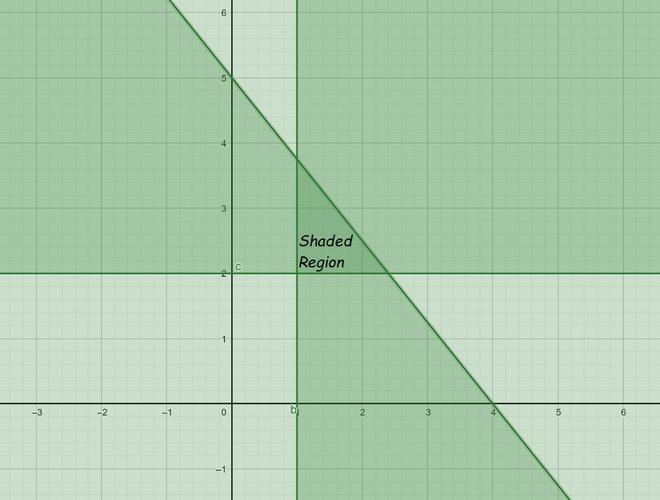
Question 2: 3x + 2y ≤ 12, x ≥ 1, y ≥ 2
Solution:
For equation 1:
Now draw a solid line 3x + 2y = 12 in the graph (because (3x + 2y = 12) is the part of the given equation)
we need at least two solutions of the equation. So, we can use the following table to draw the graph:
Consider 3x + 2y ≤ 12
Lets, select origin point (0, 0)
⇒ 0 + 0 ≤ 12
⇒ 0 + 0 ≤ 12 (this is true)
Hence, Solution region of the given inequality is the line 3x + 2y ≤ 12. where, Origin is included in the region
For equation 2:
Now draw a solid line x = 1 in the graph (because (x = 1) is the part of the given equation)
we need at least two solutions of the equation. So, we can use the following table to draw the graph:
Consider x ≥ 1
Lets, select origin point (0, 0)
⇒ 0 ≥ 1
⇒ 0 ≥ 1 (this not is true)
Hence, Solution region of the given inequality is the line x ≥ 1. where, Origin is not included in the region
For equation 3:
Now draw a solid line y = 2 in the graph (because (y = 2) is the part of the given equation)
we need at least two solutions of the equation. So, we can use the following table to draw the graph:
Consider y ≥ 2
Lets, select origin point (0, 0)
⇒ 0 ≥ 2
⇒ 0 ≥ 2 (this not is true)
Hence, Solution region of the given inequality is the line y ≥ 2. where, Origin is not included in the region
The graph will be as follows for Equation 1, 2 and 3:
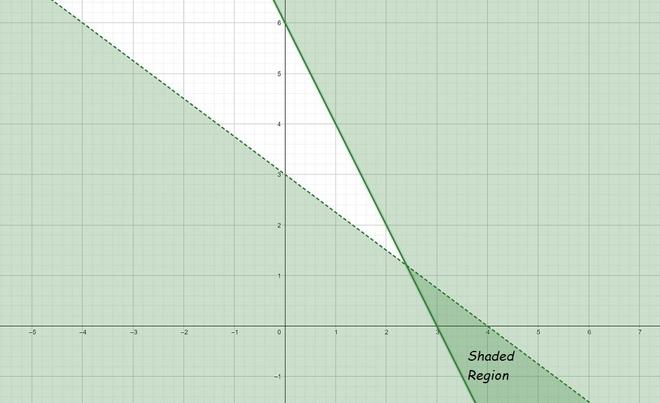
Question 3: 2x + y ≥ 6, 3x + 4y < 12
Solution:
For equation 1:
Now draw a solid line 2x + y = 6 in the graph (because (2x + y = 6) is the part of the given equation)
we need at least two solutions of the equation. So, we can use the following table to draw the graph:
Consider 2x + y ≥ 6
Lets, select origin point (0, 0)
⇒ 0 + 0 ≥ 6
⇒ 0 ≥ 6 (this is not true)
Hence, Solution region of the given inequality is the line 2x + y ≥ 6. where, Origin is not included in the region
For equation 2:
Now draw a dotted line 3x + 4y = 12 in the graph (because (3x + 4y = 12) is NOT the part of the given equation)
we need at least two solutions of the equation. So, we can use the following table to draw the graph:
Consider 3x + 4y < 12
Lets, select origin point (0, 0)
⇒ 0 + 0 < 12
⇒ 0 < 12 (this is true)
Hence, Solution region of the given inequality is the line 3x + 4y < 12. where, Origin is included in the region.
The graph will be as follows for Equation 1 and 2:
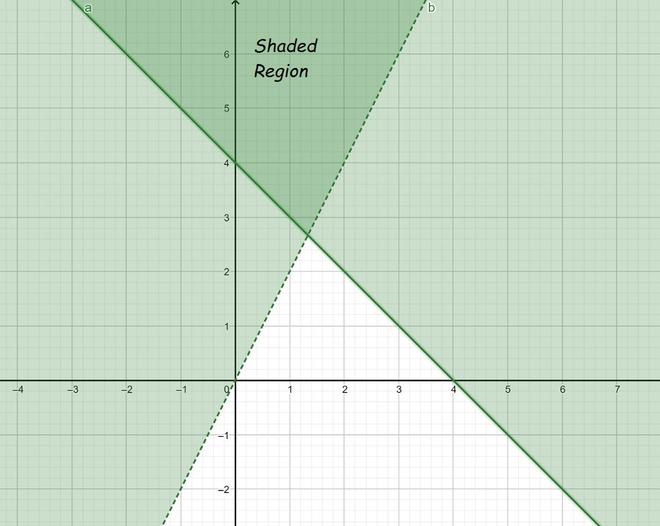
Question 4: x + y ≥ 4, 2x – y < 0
Solution:
For equation 1:
Now draw a solid line x + y = 4 in the graph (because (x + y = 4) is the part of the given equation)
we need at least two solutions of the equation. So, we can use the following table to draw the graph:
Consider x + y ≥ 4
Lets, select origin point (0, 0)
⇒ 0 + 0 ≥ 4
⇒ 0 ≥ 4 (this is not true)
Hence, Solution region of the given inequality is the line x + y ≥ 4. where, Origin is not included in the region
For equation 2:
Now draw a dotted line 2x – y = 0 in the graph (because (2x – y = 0) is NOT the part of the given equation)
we need at least two solutions of the equation. So, we can use the following table to draw the graph:
Consider 2x – y < 0
Lets, select point (3, 0)
⇒ 6 – 0 < 0
⇒ 0 > 6 (this is not true)
Hence, Solution region of the given inequality is the line 2x – y < 0. where, the point (3,0) is included in the region.
The graph will be as follows for Equation 1 and 2:
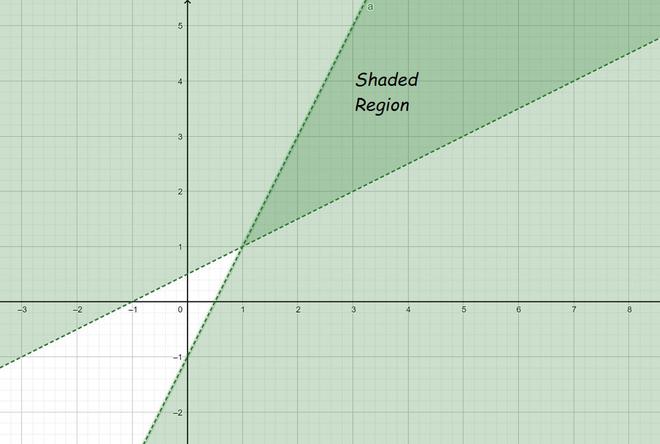
Question 5: 2x – y >1, x – 2y < – 1
Solution:
For equation 1:
Now draw a dotted line 2x – y =1 in the graph (because (2x – y =1) is NOT the part of the given equation)
we need at least two solutions of the equation. So, we can use the following table to draw the graph:
Consider 2x – y >1
Lets, select origin point (0, 0)
⇒ 0 – 0 > 1
⇒ 0 > 1 (this is not true)
Hence, Solution region of the given inequality is the line 2x – y >1. where, Origin is not included in the region
For equation 2:
Now draw a dotted line x – 2y = – 1 in the graph (because (x – 2y = – 1) is NOT the part of the given equation)
we need at least two solutions of the equation. So, we can use the following table to draw the graph:
Consider x – 2y < – 1
Lets, select point (3, 0)
⇒ 0 – 0 < -1
⇒ 0 < -1 (this is not true)
Hence, Solution region of the given inequality is the line x – 2y < – 1. Origin is not included in the region
The graph will be as follows for Equation 1 and 2:
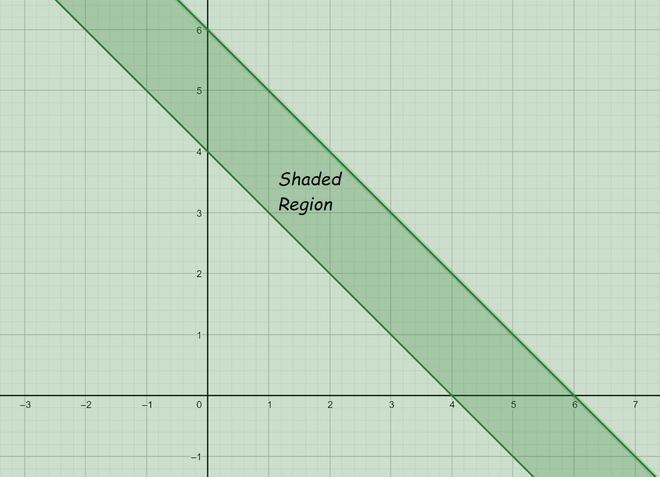
Question 6: x + y ≤ 6, x + y ≥ 4
Solution:
For equation 1:
Now draw a solid line x + y = 6 in the graph (because (x + y = 6) is the part of the given equation)
we need at least two solutions of the equation. So, we can use the following table to draw the graph:
Consider x + y ≤ 6
Lets, select origin point (0, 0)
⇒ 0 + 0 ≤ 6
⇒ 0 ≤ 6 (this is true)
Hence, Solution region of the given inequality is the line x + y ≤ 6. where, Origin is included in the region
For equation 2:
Now draw a solid line x + y = 4 in the graph (because (x + y = 4) is the part of the given equation)
we need at least two solutions of the equation. So, we can use the following table to draw the graph:
Consider x + y ≥ 4
Lets, select origin point (0, 0)
⇒ 0 + 0 ≥ 4
⇒ 0 ≥ 4 (this not is true)
Hence, Solution region of the given inequality is the line x + y ≥ 4. where, Origin is not included in the region
The graph will be as follows for Equation 1 and 2:
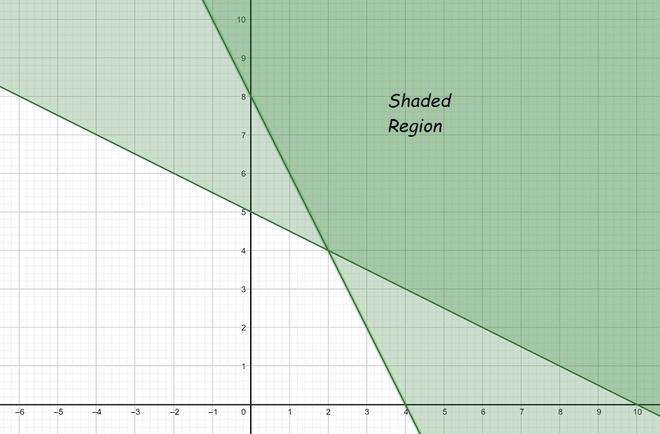
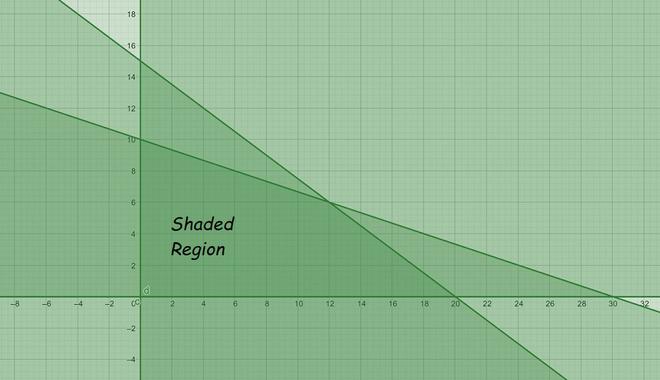
Question 7: 2x + y ≥ 8, x + 2y ≥ 10
Solution:
For equation 1:
Now draw a solid line 2x + y = 8 in the graph (because (2x + y = 8) is the part of the given equation)
we need at least two solutions of the equation. So, we can use the following table to draw the graph:
Consider 2x + y ≥ 8
Lets, select origin point (0, 0)
⇒ 0 + 0 ≥ 8
⇒ 0 ≥ 8 (this is not true)
Hence, Solution region of the given inequality is the line 2x + y ≥ 8. where, Origin is not included in the region
For equation 2:
Now draw a solid line x + 2y = 10 in the graph (because (x + 2y = 10) is the part of the given equation)
we need at least two solutions of the equation. So, we can use the following table to draw the graph:
Consider x + 2y ≥ 10
Lets, select origin point (0, 0)
⇒ 0 + 0 ≥ 10
⇒ 0 ≥ 10 (this not is true)
Hence, Solution region of the given inequality is the line x + 2y ≥ 10. where, Origin is not included in the region
The graph will be as follows for Equation 1 and 2:
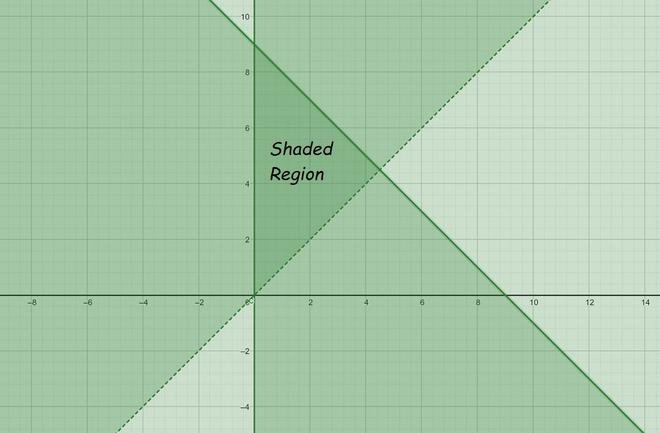
Question 8: x + y ≤ 9, y > x, x ≥ 0
Solution:
For equation 1:
Now draw a solid line x + y = 9 in the graph (because (x + y = 9) is the part of the given equation)
we need at least two solutions of the equation. So, we can use the following table to draw the graph:
Consider x + y ≤ 9
Lets, select origin point (0, 0)
⇒ 0 + 0 ≤ 9
⇒ 0 ≤ 9 (this is true)
Hence, Solution region of the given inequality is the line x + y ≤ 9. where, Origin is included in the region
For equation 2:
Now draw a dotted line y = x in the graph (because (y = x) is NOT the part of the given equation)
we need at least two solutions of the equation. So, we can use the following table to draw the graph:
Consider y > x
Lets, select point (3, 0)
⇒ 0 > 3
⇒ 0 > 3 (this is not true)
Hence, Solution region of the given inequality is the line y > x. the point (3,0) is not included in the region.
For equation 3:
Now draw a solid line x = 0 in the graph (because (x = 0) is the part of the given equation)
we need at least two solutions of the equation. So, we can use the following table to draw the graph:
Consider x ≥ 0
Lets, select point (3, 0)
⇒ 3 ≥ 0
⇒ 3 ≥ 0 (this is true)
Hence, Solution region of the given inequality is the line x ≥ 0. where, the point (3,0) is included in the region.
The graph will be as follows for Equation 1, 2 and 3:
Question 9: 5x + 4y ≤ 20, x ≥ 1, y ≥ 2
Solution:
For equation 1:
Now draw a solid line 5x + 4y = 20 in the graph (because (5x + 4y = 20) is the part of the given equation)
we need at least two solutions of the equation. So, we can use the following table to draw the graph:
Consider 5x + 4y ≤ 20
Lets, select origin point (0, 0)
⇒ 0 + 0 ≤ 20
⇒ 0 ≤ 20 (this is true)
Hence, Solution region of the given inequality is the line 5x + 4y ≤ 20. where, Origin is included in the region
For equation 2:
Now draw a solid line x = 1 in the graph (because (x = 1) is the part of the given equation)
we need at least two solutions of the equation. So, we can use the following table to draw the graph:
Consider x ≥ 1
Lets, select origin point (0, 0)
⇒ 0 ≥ 1
⇒ 0 ≥ 1 (this not is true)
Hence, Solution region of the given inequality is the line x ≥ 1. where, Origin is not included in the region
For equation 3:
Now draw a solid line y = 2 in the graph (because (y = 2) is the part of the given equation)
we need at least two solutions of the equation. So, we can use the following table to draw the graph:
Consider y ≥ 2
Lets, select origin point (0, 0)
⇒ 0 ≥ 2
⇒ 0 ≥ 2 (this not is true)
Hence, Solution region of the given inequality is the line y ≥ 2. where, Origin is not included in the region
The graph will be as follows for Equation 1, 2 and 3:
Question 10: 3x + 4y ≤ 60, x +3y ≤ 30, x ≥ 0, y ≥ 0
Solution:
For equation 1:
Now draw a solid line 3x + 4y = 60 in the graph (because (3x + 4y = 60) is the part of the given equation)
we need at least two solutions of the equation. So, we can use the following table to draw the graph:
Consider 3x + 4y ≤ 60
Lets, select origin point (0, 0)
⇒ 0 + 0 ≤ 60
⇒ 0 ≤ 60 (this is true)
Hence, Solution region of the given inequality is the line 3x + 4y ≤ 60. where, Origin is included in the region
For equation 2:
Now draw a solid line x +3y = 30 in the graph (because (x +3y = 30) is the part of the given equation)
we need at least two solutions of the equation. So, we can use the following table to draw the graph:
Consider x +3y ≤ 30
Lets, select origin point (0, 0)
⇒ 0 + 0 ≤ 30
⇒ 0 ≤ 30 (this is true)
Hence, Solution region of the given inequality is the line x +3y ≤ 30. where, Origin is included in the region
For equation 3:
Now draw a solid line x = 0 in the graph (because (x = 0) is the part of the given equation)
we need at least two solutions of the equation. So, we can use the following table to draw the graph:
Consider x ≥ 0
Lets, select point (3, 0)
⇒ 3 ≥ 0
⇒ 3 ≥ 0 (this is true)
Hence, Solution region of the given inequality is the line x ≥ 0. where, the point (3,0) is included in the region.
For equation 4:
Now draw a solid line y = 0 in the graph (because (y = 0) is the part of the given equation)
we need at least two solutions of the equation. So, we can use the following table to draw the graph:
Consider y ≥ 0
Lets, select point (0,3)
⇒ 3 ≥ 0
⇒ 3 ≥ 0 (this is true)
Hence, Solution region of the given inequality is the line y ≥ 0. where, the point (0,3) is included in the region.
The graph will be as follows for Equation 1, 2. 3 and 4:
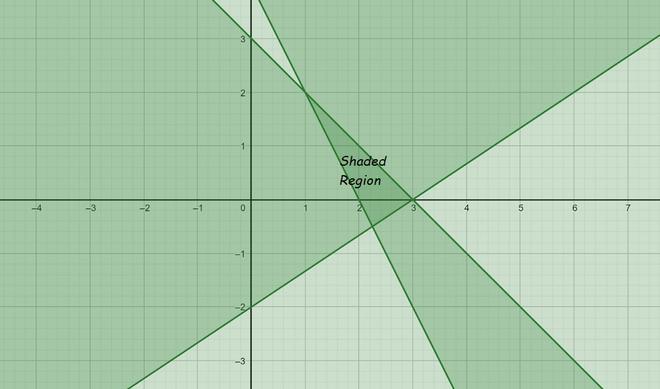
Question 11: 2x + y ≥ 4, x + y ≤ 3, 2x – 3y ≤ 6
Solution:
For equation 1:
Now draw a solid line 2x + y = 4 in the graph (because (2x + y = 4) is the part of the given equation)
we need at least two solutions of the equation. So, we can use the following table to draw the graph:
Consider 2x + y ≥ 4
Lets, select origin point (0, 0)
⇒ 0 + 0 ≥ 4
⇒ 0 ≥ 4 (this is not true)
Hence, Solution region of the given inequality is the line 2x + y ≥ 4. where, Origin is not included in the region
For equation 2:
Now draw a solid line x + y = 3 in the graph (because (x + y = 3) is the part of the given equation)
we need at least two solutions of the equation. So, we can use the following table to draw the graph:
Consider x + y ≤ 3
Lets, select origin point (0, 0)
⇒ 0 + 0 ≤ 3
⇒ 0 ≤ 3 (this is true)
Hence, Solution region of the given inequality is the line x + y ≤ 3. where, Origin is included in the region
For equation 3:
Now draw a solid line 2x – 3y = 6 in the graph (because (2x – 3y = 6) is the part of the given equation)
we need at least two solutions of the equation. So, we can use the following table to draw the graph:
Consider 2x – 3y ≤ 6
Lets, select origin point (0, 0)
⇒ 0 – 0 ≤ 6
⇒ 0 ≤ 6 (this is true)
Hence, Solution region of the given inequality is the line 2x – 3y ≤ 6. where, Origin is included in the region
The graph will be as follows for Equation 1, 2 and 3:
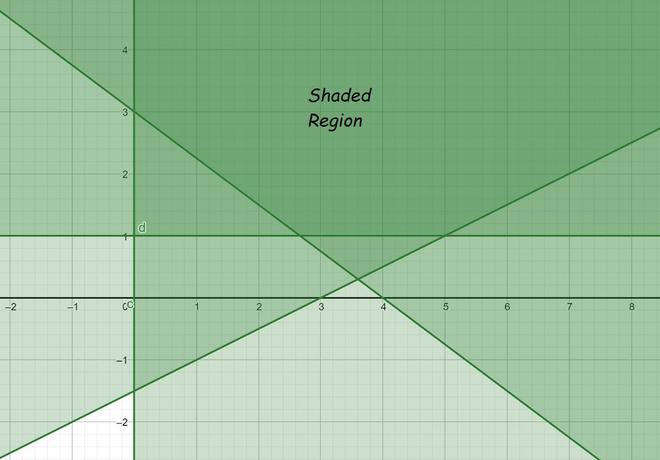
Question 12: x – 2y ≤ 3, 3x + 4y ≥ 12, x ≥ 0 , y ≥ 1
Solution:
For equation 1:
Now draw a solid line x – 2y = 3 in the graph (because (x – 2y = 3) is the part of the given equation)
we need at least two solutions of the equation. So, we can use the following table to draw the graph:
Consider x – 2y ≤ 3
Lets, select origin point (0, 0)
⇒ 0 – 0 ≤ 3
⇒ 0 ≤ 3 (this is true)
Hence, Solution region of the given inequality is the line x – 2y ≤ 3. where, Origin is included in the region
For equation 2:
Now draw a solid line 3x + 4y = 12 in the graph (because (3x + 4y = 12) is the part of the given equation)
we need at least two solutions of the equation. So, we can use the following table to draw the graph:
Consider 3x + 4y ≥ 12
Lets, select origin point (0, 0)
⇒ 0 + 0 ≥ 12
⇒ 0 ≥ 12 (this is not true)
Hence, Solution region of the given inequality is the line 3x + 4y ≥ 12. where, Origin is not included in the region
For equation 3:
Now draw a solid line x = 0 in the graph (because (x = 0) is the part of the given equation)
we need at least two solutions of the equation. So, we can use the following table to draw the graph:
Consider x ≥ 0
Lets, select point (3, 0)
⇒ 3 ≥ 0
⇒ 3 ≥ 0 (this is true)
Hence, Solution region of the given inequality is the line x ≥ 0. where, the point (3,0) is included in the region.
For equation 4:
Now draw a solid line y = 1 in the graph (because (y = 1) is the part of the given equation)
we need at least two solutions of the equation. So, we can use the following table to draw the graph:
Consider y ≥ 1
Lets, select origin point (0, 0)
⇒ 0 ≥ 1
⇒ 0 ≥ 1 (this is not true)
Hence, Solution region of the given inequality is the line y ≥ 1. where, Origin is not included in the region
The graph will be as follows for Equation 1, 2. 3 and 4:
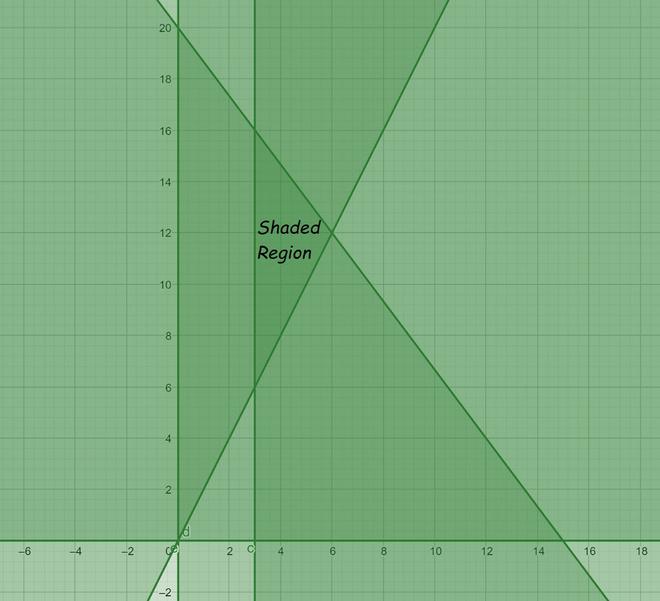
Question 13: 4x + 3y ≤ 60, y ≥ 2x, x ≥ 3, x, y ≥ 0
Solution:
For equation 1:
Now draw a solid line 4x + 3y = 60 in the graph (because (4x + 3y = 60) is the part of the given equation)
we need at least two solutions of the equation. So, we can use the following table to draw the graph:
Consider 4x + 3y ≤ 60
Lets, select origin point (0, 0)
⇒ 0 + 0 ≤ 60
⇒ 0 ≤ 60 (this is true)
Hence, Solution region of the given inequality is the line 4x + 3y ≤ 60. where, Origin is included in the region
For equation 2:
Now draw a solid line y = 2x in the graph (because (y = 2x) is the part of the given equation)
we need at least two solutions of the equation. So, we can use the following table to draw the graph:
Consider y ≥ 2x
Lets, select point (3, 0)
⇒ 0 ≥ 6
⇒ 0 ≥ 6 (this is not true)
Hence, Solution region of the given inequality is the line y ≥ 2x. where, the point (3,0) is not included in the region.
For equation 3:
Now draw a solid line x = 3 in the graph (because (x = 3) is the part of the given equation)
we need at least two solutions of the equation. So, we can use the following table to draw the graph:
Consider x ≥ 3
Lets, select origin point (0, 0)
⇒ 0 ≥ 3
⇒ 0 ≥ 3 (this is not true)
Hence, Solution region of the given inequality is the line x ≥ 3. where, Origin is not included in the region
For equation 4:
Now draw a solid line x = 0 in the graph (because (x = 0) is the part of the given equation)
we need at least two solutions of the equation. So, we can use the following table to draw the graph:
Consider x ≥ 0
Lets, select point (3, 0)
⇒ 3 ≥ 0
⇒ 3 ≥ 0 (this is true)
Hence, Solution region of the given inequality is the line x ≥ 0. where, the point (3,0) is included in the region.
For equation 5:
Now draw a solid line y = 0 in the graph (because (y = 0) is the part of the given equation)
we need at least two solutions of the equation. So, we can use the following table to draw the graph:
Consider y ≥ 0
Lets, select point (0,3)
⇒ 3 ≥ 0
⇒ 3 ≥ 0 (this is true)
Hence, Solution region of the given inequality is the line y ≥ 0. where, the point (0,3) is included in the region.
The graph will be as follows for Equation 1, 2. 3, 4 and 5:
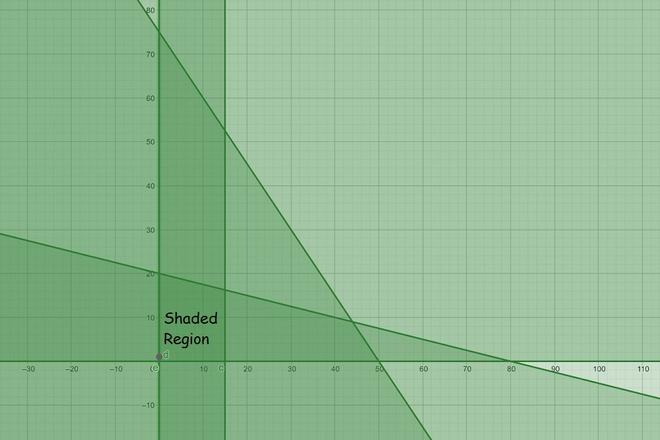
Question 14: 3x + 2y ≤ 150, x + 4y ≤ 80, x ≤ 15, y ≥ 0, x ≥ 0
Solution:
For equation 1:
Now draw a solid line 3x + 2y = 150 in the graph (because (3x + 2y = 150) is the part of the given equation)
we need at least two solutions of the equation. So, we can use the following table to draw the graph:
Consider 3x + 2y ≤ 150
Lets, select origin point (0, 0)
⇒ 0 + 0 ≤ 150
⇒ 0 ≤ 150 (this is true)
Hence, Solution region of the given inequality is the line 3x + 2y ≤ 150. where, Origin is included in the region
For equation 2:
Now draw a solid line x + 4y = 80 in the graph (because (x + 4y = 80) is the part of the given equation)
we need at least two solutions of the equation. So, we can use the following table to draw the graph:
Consider x + 4y ≤ 80
Lets, select origin point (0, 0)
⇒ 0 + 0 ≤ 80
⇒ 0 ≤ 80 (this is true)
Hence, Solution region of the given inequality is the line x + 4y ≤ 80. where, Origin is included in the region
For equation 3:
Now draw a solid line x = 15 in the graph (because (x = 15) is the part of the given equation)
we need at least two solutions of the equation. So, we can use the following table to draw the graph:
Consider x ≤ 15
Lets, select origin point (0, 0)
⇒ 0 ≤ 15
⇒ 0 ≤ 15 (this is true)
Hence, Solution region of the given inequality is the line x ≤ 15. where, Origin is included in the region
For equation 4:
Now draw a solid line x = 0 in the graph (because (x = 0) is the part of the given equation)
we need at least two solutions of the equation. So, we can use the following table to draw the graph:
Consider x ≥ 0
Lets, select point (3, 0)
⇒ 3 ≥ 0
⇒ 3 ≥ 0 (this is true)
Hence, Solution region of the given inequality is the line x ≥ 0. where, the point (3,0) is included in the region.
For equation 5:
Now draw a solid line y = 0 in the graph (because (y = 0) is the part of the given equation)
we need at least two solutions of the equation. So, we can use the following table to draw the graph:
Consider y ≥ 0
Lets, select point (0,3)
⇒ 3 ≥ 0
⇒ 3 ≥ 0 (this is true)
Hence, Solution region of the given inequality is the line y ≥ 0. where, the point (0,3) is included in the region.
The graph will be as follows for Equation 1, 2. 3, 4 and 5:
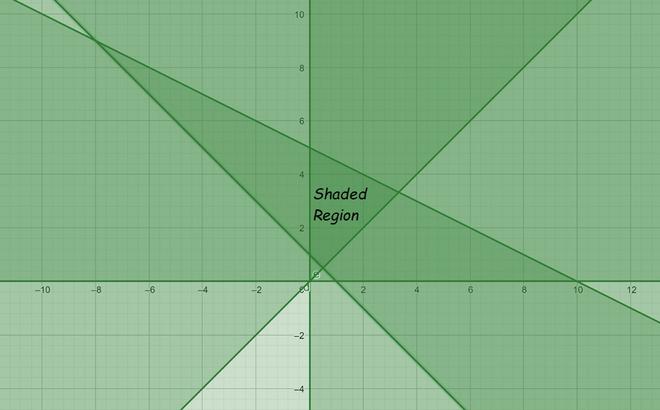
Question 15: x + 2y ≤ 10, x + y ≥ 1, x – y ≤ 0, x ≥ 0, y ≥ 0
Solution:
For equation 1:
Now draw a solid line x + 2y = 10 in the graph (because (x + 2y = 10) is the part of the given equation)
we need at least two solutions of the equation. So, we can use the following table to draw the graph:
Consider x + 2y ≤ 10
Lets, select origin point (0, 0)
⇒ 0 + 0 ≤ 10
⇒ 0 ≤ 10 (this is true)
Hence, Solution region of the given inequality is the line x + 2y ≤ 10. where, Origin is included in the region
For equation 2:
Now draw a solid line x + y = 1 in the graph (because (x + y = 1) is the part of the given equation)
we need at least two solutions of the equation. So, we can use the following table to draw the graph:
Consider x + y ≥ 1
Lets, select origin point (0, 0)
⇒ 0 + 0 ≥ 1
⇒ 0 ≥ 1 (this is true)
Hence, Solution region of the given inequality is the line x + y ≥ 1. where, Origin is included in the region
For equation 3:
Now draw a solid line x – y = 0 in the graph (because (x – y = 0) is the part of the given equation)
we need at least two solutions of the equation. So, we can use the following table to draw the graph:
Consider x – y ≤ 0
Lets, select point (3, 0)
⇒ 3 – 0 ≤ 0
⇒ 3 ≤ 0 (this is not true)
Hence, Solution region of the given inequality is the line x – y ≤ 0. where, the point (3,0) is not included in the region
For equation 4:
Now draw a solid line x = 0 in the graph (because (x = 0) is the part of the given equation)
we need at least two solutions of the equation. So, we can use the following table to draw the graph:
Consider x ≥ 0
Lets, select point (3, 0)
⇒ 3 ≥ 0
⇒ 3 ≥ 0 (this is true)
Hence, Solution region of the given inequality is the line x ≥ 0. where, the point (3,0) is included in the region.
For equation 5:
Now draw a solid line y = 0 in the graph (because (y = 0) is the part of the given equation)
we need at least two solutions of the equation. So, we can use the following table to draw the graph:
Consider y ≥ 0
Lets, select point (0,3)
⇒ 3 ≥ 0
⇒ 3 ≥ 0 (this is true)
Hence, Solution region of the given inequality is the line y ≥ 0. where, the point (0,3) is included in the region.
The graph will be as follows for Equation 1, 2. 3, 4 and 5:
Share your thoughts in the comments
Please Login to comment...