Graphs of the functions give us a lot of information about the nature of the function, the trends, and the critical points like maxima and minima of the function. Derivatives allow us to mathematically analyze these functions and their sign can give us information about the maximum and minimum of the function which is necessary for plotting the graphs. Sometimes simply knowing if a function’s graph is increasing or decreasing is not enough, we also need to look at the direction of the bending of the graph. The direction tells us whether the function is concave upwards or downwards. Let’s see how to identify these trends using derivatives.
What are Concave Functions?
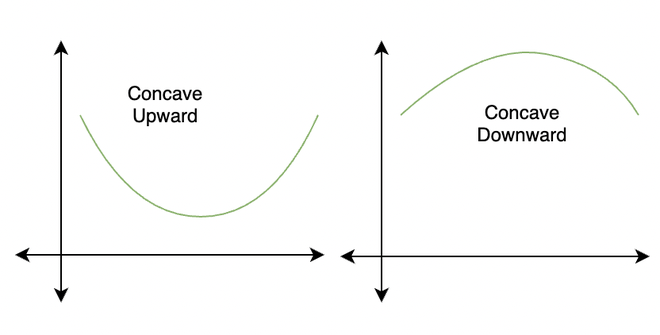
A Concave function is also called a Concave downward graph. Intuitively, the Concavity of the function means the direction in which the function opens, concavity describes the state or the quality of a Concave function. For example, if the function opens upwards it is called concave up and if it opens downwards it is called concave down. The figure below shows two functions which are concave upwards and concave downwards respectively.
Analyzing Concavity of Concave Functions Using Graphs
The concavity can also be identified by drawing tangents at points on the graph. For example, a graph is said to be concave up at a point if a tangent drawn to the graph at that point lies below the graph in the vicinity of that point. Similarly, the graph is said to be concave downward at a point if a tangent is drawn to the graph that point lies above the graph in the vicinity of that point. This can be seen in the figure given below,
Notice that there can also be a point where the tangent drawn to it lies neither above the graph nor below the graph. Such tangents intersect the graph on that point. At such point, concavity changes from upwards to downwards or vice-versa. This point is called the point of inflection.
Now let’s look at the formal definition for all these points,
Let’s say we have a function f(x),
- f(x) is said to be concave up in the interval I if all the possible tangents drawn to the curve at different points in the interval I, lie below the graph.
- f(x) is said to be concave downwards in the interval I if all the possible tangents drawn to the curve at different points in the interval I, lie above the graph.
A point x = a on the curve f(x) is called point of inflection if the function is continuous and the concavity of the graph changes at that point.
Analyzing State of Concave Functions (Concavity) Using Derivatives
The above method is a graphical method of analyzing the concavity of the function, but sometimes we do not have the graph of the function. When we have no knowledge about the graph of the function, derivatives come to our rescue. Let’s say we have a function f(x). Considering the different cases given in the figure below, we know that the slope of the tangent gives us the value of the derivative of the function at that point of contact.
Notice that in the figure above, when the function is concave downward, the slope of the tangent is decreasing in value which means the derivatives are decreasing. Similarly, when the function is concave upward the value of the derivatives is increasing. Thus, we can make the following conclusions:
- If the function is concave up, its derivative f'(x) is increasing.
- If the function is concave down, its derivative f'(x) is decreasing.
- When the function f(x) has an inflection point at point x = a. f'(x) either goes from increasing to decreasing or vice-versa. That means the graph of the function f'(x) has a minimum/maximum at x = a.
We can draw mathematical rules from these observations given above,
Let’s say we have a function f(x),
- For the interval I, if f”(x) > 0 then the function f(x) is concave up in the interval I.
- For the interval I, if f”(x) < 0 then the function f(x) is concave down in the interval I.
- If x = a is a point of inflection, then at x = a, f”(a) = 0.
Solved Examples on Concave Function
Example 1: What should be the value of “a” for the function f(x) = ax3 + 4x2 + 1 to be concave downward at x = 1.
Solution:
We need to analyze the functions through the second derivative test explained above,
f(x) = ax2 + 4x + 1
Differentiating the function,
⇒ f'(x) = 3ax2 + 8x
Differentiating it again to find the second derivative,
⇒ f”(x) = 6ax + 8
At x = 1.
f”(1) = 6a + 8
For the function to be concave downward, f”(x) < 0
6a + 8 < 0
⇒ a = 
Example 2: What is the shape of the graph for the function f(x) =  at x = 2.
Solution:
We need to analyze the functions through the second derivative test explained above,
f(x) = 
Differentiating the function,
⇒ f'(x) = 
Differentiating it again to find the second derivative,
⇒ f”(x) = 
At x = 2.
f”(x) =
⇒ f”(x) = 
f”(2) = 
So, f”(2) < 0. Thus, from the definition above we can say that, the shape of the function is concave downward at x = 2.
Example 3: What is the shape of the graph for the function f(x) = x2 + x + 1 at x = 0.
Solution:
We need to analyze the functions through the second derivative test explained above,
f(x) = x2 + x + 1
Differentiating the function,
⇒ f'(x) = 2x + 1
Differentiating it again to find the second derivative,
⇒ f”(x) = 2
At x = 2.
f”(0) = 2
So, f”(0) > 0. Thus, from the definition above we can say that, the shape of the function is concave upward at x = 2.
Example 4: What is the shape of the graph for the function f(x) = x3 + 4x2 + 1 at x = 0.
Solution:
We need to analyze the functions through the second derivative test explained above,
f(x) = x3 + 4x2 + 1
Differentiating the function,
⇒ f'(x) = 3x2 + 8x
Differentiating it again to find the second derivative,
⇒ f”(x) = 6x + 8
At x = 0.
f”(0) = 8
So, f”(0) > 0. Thus, from the definition above we can say that, the shape of the function is concave upward at x = 0.
Example 5: Tell whether the graph of the function f(x) = ex + cos(x) is concave up or concave downward at x = 0.
Answer:
We need to analyze the functions through the second derivative test explained above,
f(x) = ex + cos(x)
Differentiating the function,
⇒ f'(x) = ex – sin(x)
Differentiating it again to find the second derivative,
⇒ f”(x) = ex – cos(x)
At x = 0.
f”(0) = e0 – cos(0)
⇒f”(0) = 1 – 1
⇒f”(0) = 0
Since, f”(0) =0. From the definition above we can say that, the function is neither concave up or concave downward at x = 0. So, x = 0 is point of inflection for the function f(x).
Example 6: Plot the graph of the function f(x) = (x – 3)2 + 5.
Solution:
First let’s check for the asymptotic values for the function f(x).
at x = ∞ and x = -∞ the function f(x) goes towards positive infinity.
at x = 0
f(0) = 32 + 5
⇒ f(0) = 14
Let’s look for the critical points,
f(x) = (x-3)2 + 5
Differentiating f(x) w.r.t. x,
f'(x) = 2(x – 3)
Solving,
f'(x) = 0
⇒ 2(x – 3) = 0
⇒x = 3
x = 3 is a minima.
Now let’s see what will be the shape of the graph at x = 3
f”(x) = 2
f”(x) > 0 Thus the graph will be concave upward.
Thus, the graph of the function will look like,
Share your thoughts in the comments
Please Login to comment...