Python Seaborn – Strip plot illustration using Catplot
Last Updated :
28 Dec, 2021
Seaborn is a data visualization library that is based on matplotlib. A high-level interface is provided by seaborn for drawing informative and attractive statistical graphics. Seaborn Catplot is a new addition to seaborn that makes plotting easier and involves categorical variables. It is used to show the relation between categorical variables like strip plot, box plot and so more with numerical variables.
Stripplot which is represented by strip is the default illustration in catplot().
Step-by-step Approach:
Python3
import pandas as pnd
import matplotlib.pyplot as plt
import seaborn as sbn
|
- Assign dataset and convert it into a data frame.
Python3
input_data=pnd.read_csv(url_data)
|
Output:

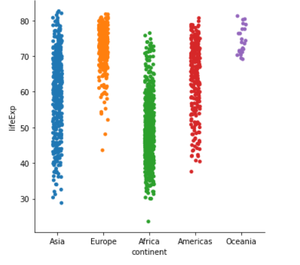
- Finally, depict the illustration.
Python3
sbn.catplot(x='continent', y='lifeExp', data=input_data)
|
Output:
Below is the complete program based on the above approach:
Python3
import pandas as pnd
import matplotlib.pyplot as plt
import seaborn as sbn
input_data=pnd.read_csv(url_data)
sbn.catplot(x='continent', y='lifeExp', data=input_data)
|
Output:
Share your thoughts in the comments
Please Login to comment...