How To Make Simple Facet Plots with Seaborn Catplot in Python?
Last Updated :
26 Nov, 2020
Seaborn is an amazing visualization library for statistical graphics plotting in Python. It provides beautiful default styles and color palettes to make statistical plots more attractive. It is built on the top of matplotlib library and also closely integrated into the data structures from pandas.
Seaborn aims to make visualization of the central part of exploring and understanding data. It provides dataset-oriented APIs, so that we can switch between different visual representations for the same variables for a better understanding of the dataset.
Facet plots, where one subsets the data based on a categorical variable and makes a series of similar plots with the same scale.
We can make facet plots in Python in multiple ways. In this post, we will see an example of making simple facet plots using Seaborn’s Catplot() method. It is mostly used to visualize when there is a numerical variable and a corresponding categorical variable.
Steps Required
- Import Libraries.
- Import or create data.
- Use Catplot() method with the facet plot.
- Use other arguments for better visualization.
Dataset Used
The dataset used in the below example is https://www.kaggle.com/ranjeetjain3/seaborn-tips-dataset
Below are some examples which depict facet plot illustration using Seaborn module:
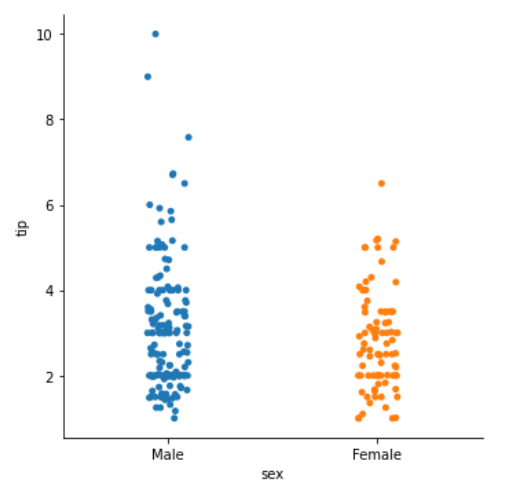
Example 1:
Python3
import seaborn
tip = seaborn.load_dataset('tips')
seaborn_facetgrid_object = seaborn.catplot(
x='sex',
y='tip',
data=tip
)
seaborn_facetgrid_object
|
Output:
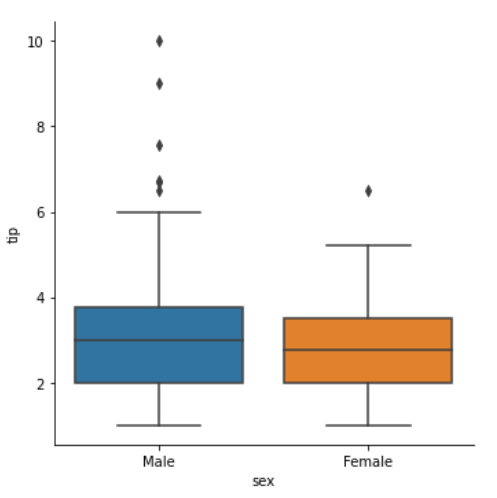
Example 2:
Python3
import seaborn
tip = seaborn.load_dataset('tips')
seaborn_facetgrid_object = seaborn.catplot(
x='sex',
y='tip',
kind='box',
data=tip
)
seaborn_facetgrid_object
|
Output:
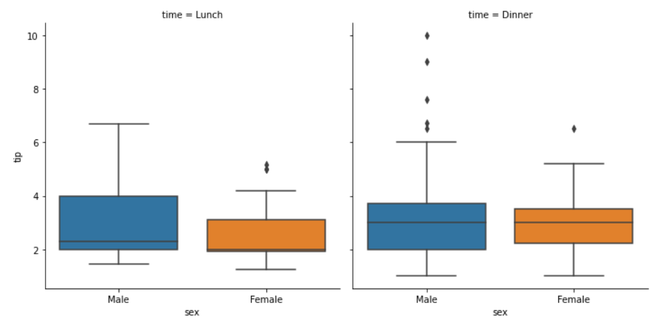
Example 3:
Python3
import seaborn
tip = seaborn.load_dataset('tips')
seaborn_facetgrid_object = seaborn.catplot(
x='sex',
y='tip',
col='time',
kind='box',
data=tip
)
seaborn_facetgrid_object
|
Output:
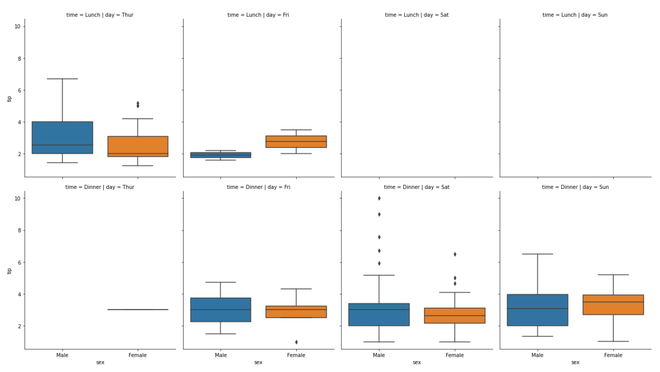
Example 4:
Python3
import seaborn
tip = seaborn.load_dataset('tips')
seaborn_facetgrid_object = seaborn.catplot(
x='sex',
y='tip',
row='time',
col='day',
aspect=0.9,
dodge=False,
kind='box',
data=tip
)
seaborn_facetgrid_object
|
Output:
Like Article
Suggest improvement
Share your thoughts in the comments
Please Login to comment...