How to Make Horizontal Violin Plot with Seaborn in Python?
Last Updated :
16 Nov, 2020
In this article, we are going to plot a horizontal Violin plot with seaborn. We can use two methods for the Drawing horizontal Violin plot, Violinplot() and catplot().
Method 1: Using violinplot()
A violin plot plays a similar activity that is pursued through whisker or box plot do. As it shows several quantitative data across one or more categorical variables. It can be an effective and attractive way to show multiple data at several units. A “wide-form” Data Frame helps to maintain each numeric column which can be plotted on the graph. It is possible to use NumPy or Python objects, but pandas objects are preferable because the associated names will be used to annotate the axes.
Syntax: seaborn.violinplot(x=None, y=None, hue=None, data=None, scale_hue=True, **kwargs)
Parameters:
x, y, hue: Inputs for plotting long-form data.
data: Dataset for plotting.
scale: The method used to scale the width of each violin.
Returns: This method returns the Axes object with the plot drawn onto it.
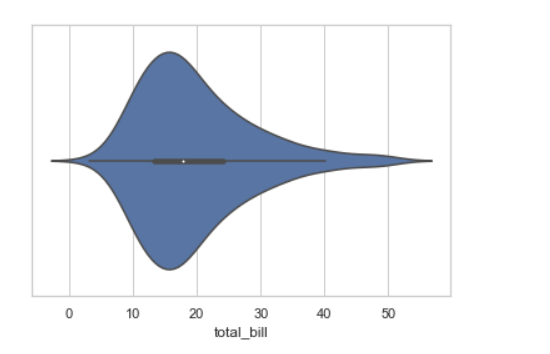
Example 1: Draw a single horizontal plot using only one axis
If we use only one data variable instead of two data variables then it means that the axis denotes each of these data variables as an axis.
X denotes an x-axis and y denote a y-axis.
Syntax:
seaborn.violinplot(x)
Python3
import seaborn
seaborn.set(style="whitegrid")
tips = seaborn.load_dataset("tips")
seaborn.violinplot(x=tips["total_bill"])
|
Output:
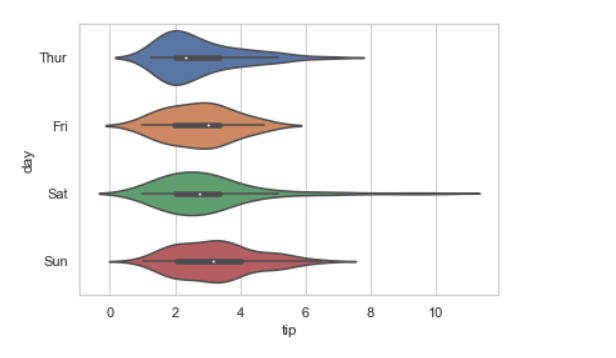
Example 2: Draw horizontal violinplot
In the above example, we see how to plot a single horizontal violinplot plot and here can perform multiple horizontal plot with exchange of the data variable with another axis.
Python3
import seaborn
seaborn.set(style="whitegrid")
tips = seaborn.load_dataset("tips")
seaborn.violinplot(x="tip", y="day", data=tips)
|
Output:
Method 2: Using catplot()
Catplot function provides access to several axes-level functions that show the relationship between a numerical and one or more categorical variables using one of several visual representations.
Syntax: seaborn.catplot(*, x=None, y=None, hue=None, data=None, kind=’strip’, **kwargs)
Parameters:
x, y, hue: Inputs for plotting long-form data.
data: Dataset for plotting.
kind: corresponds to the name of a categorical axes-level plotting function. Options are: “strip”, “swarm”, “box”, “violin”, “boxen”, “point”, “bar”, or “count”.
Returns: This method returns the Axes object with the plot drawn onto it.
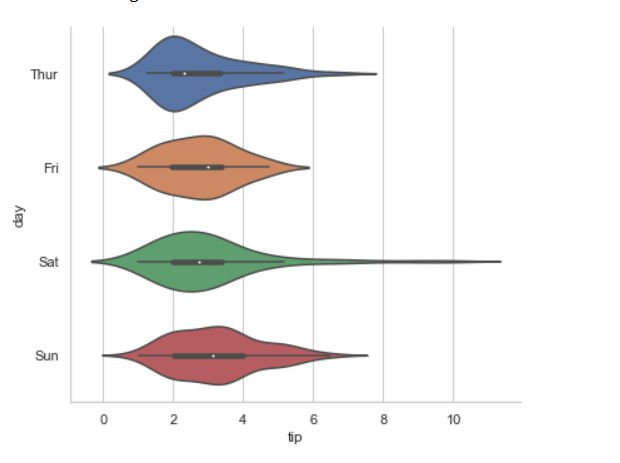
Example: Drawing horizontal violin plot with catplot()
We can simply plot the horizontal violin plot with this Catplot() function but remember for horizontal we need to use kind=” violin”, this means this will treat the Catplot as a violinplot .
Python3
import seaborn
seaborn.set(style="whitegrid")
tips = seaborn.load_dataset("tips")
seaborn.catplot(x="tip", kind="violin", aspect=1.2,
y="day", data=tips)
|
Output:
Share your thoughts in the comments
Please Login to comment...