How to Make Grouped Violinplot with Seaborn in Python?
Last Updated :
12 Nov, 2020
This article depicts how to make a grouped violinplot with Seaborn in python. Violinplot is a great way of visualizing the data as a combination of the box plot with the kernel density plots to produce a new type of plot.
For this article, we will be using the iris dataset to plot data. This comes inbuilt in seaborn and can be loaded with the load_dataset method. The iris dataset has four features ( sepal_length sepal_width petal_length petal_width) which are all numeric and one the target column ( species) which contains the names of the flowers. (Virginica, Setosa, Versicolor). In seaborn, we can plot violin plots using the seaborn.violinplot() method.
Syntax: seaborn.violinplot(x, y, hue, data, inner,linewidth,…)
Parameters:
1. x, y, hue: names of variables in data or vector data, optional
2. data: DataFrame, array, or list of arrays, optional
3. inner: {“box”, “quartile”, “point”, “stick”, None}, (optional) : Represents datapoints in the violin interior.
4. linewidth float, (optional): Width of the gray lines that frame the plot elements.
Returns:
ax: matplotlib Axes
The following examples will help you understand better:
Example 1: Plotting A single horizontal violin plot.
Python3
import seaborn as sns
import pandas as pd
datasets = sns.load_dataset('iris')
datasets.head()
sns.violinplot(datasets['sepal_length'])
|
Output:
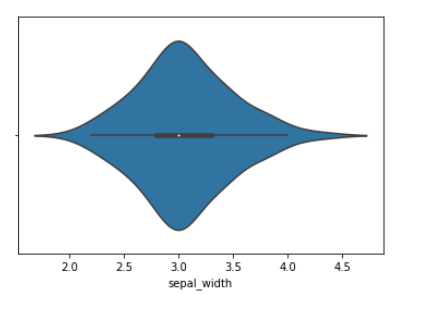
In the above plot, the small white spot is the median of the feature and the thin line represents the inter-quartile range.
Instead of just passing the singe numeric column we can pass a categorical column as well. In our case, the species.
Example 2: Plotting the grouped violin plots with Seaborn.
(Creating a grouped violin plot using the sepal_width and the species columns.)
Python3
import seaborn as sns
import pandas as pd
datasets = sns.load_dataset('iris')
datasets.head()
sns.violinplot(x='species', y='sepal_width', data=datasets,
inner="quart", linewidth=1)
|
Output:
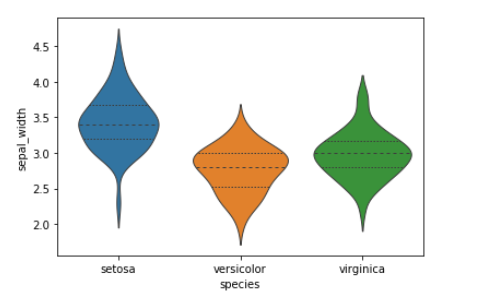
In this plot, the x-axis represents the three different species of flowers. eg (Virginica, Setosa, Versicolor). We can easily infer from the above plot that Setosa has a higher sepal width than the other two. But sepal width alone won’t help us distinguish the three categories. Hence, other features while building our ml models will need to be considered. The violin plot also gives information about the probability distribution of the features, like the Versicolor class is slightly skewed.
Example 3: Plotting Violin plot between petal_length Vs species.
Python3
import seaborn as sns
import pandas as pd
datasets = sns.load_dataset('iris')
datasets.head()
sns.violinplot(x='species', y='petal_length', data=datasets,
inner="quart", linewidth=1)
|
Output:
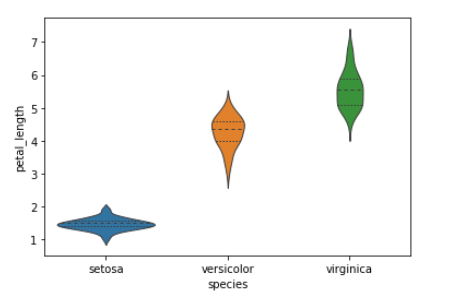
Differentiating the classes with this feature is much better than the previous one.
Share your thoughts in the comments
Please Login to comment...