Seaborn – Sort Bars in Barplot
Last Updated :
09 Dec, 2021
Prerequisite: Seaborn, Barplot
In this article, we are going to see how to sort the bar in barplot using Seaborn in python.
Seaborn is an amazing visualization library for statistical graphics plotting in Python. It provides beautiful default styles and color palettes to make statistical plots more attractive. It is built on the top of matplotlib library and also closely integrated to the data structures from pandas.
Approach:
- Import module.
- Create a Dataframe.
- Create a barplot.
- Sort the Dataframe column with DataFrame.sort_values().
- Display the sort Dataframe into the barplot.
So, Let’s implement to sort bar in barplot using seaborn with steps based on the above approach.
Step 1: Import required packages.
Python3
import pandas as pd
import numpy as np
import matplotlib.pyplot as plt
import seaborn as sns
|
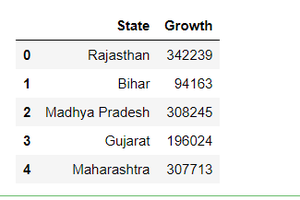
Step 2: Create a Dataframe to create a barplot.
Python3
State = ["Rajasthan", "Bihar", "Madhya Pradesh",
"Gujarat", "Maharashtra"]
growth = [342239, 94163, 308245, 196024, 307713]
df = pd.DataFrame({"State": State,
"Growth": growth})
df
|
Output:
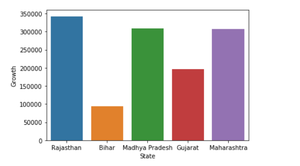
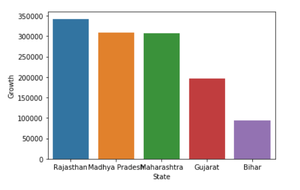
Step 3: Create a barplot with this Dataframe.
Python3
sns.barplot(x='State', y="Growth", data=df)
|
Output:
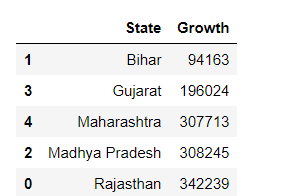
Step 4: Let’s sort the Dataframe column(Growth column) with DataFrame.sort_values().
Output:
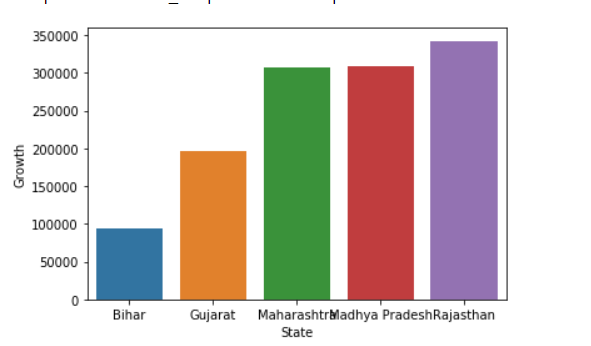
We can do this same technique in a barplot.
Python3
sns.barplot(x='State',
y="Growth", data=df,
order=df.sort_values('Growth').State)
|
Output:
Step 5: Let sort the bar with Descending order.
Python3
sns.barplot(x='State',
y="Growth", data=df,
order=df.sort_values('Growth',ascending = False).State)
|
Output:
Note: Default value of ascending is always True, if we change this parameter with False then it means that its arrange in descending order.
Below are the complete examples:
Example 1
Python3
import pandas as pd
import numpy as np
import matplotlib.pyplot as plt
import seaborn as sns
State = ["Rajasthan", "Bihar", "Madhya Pradesh",
"Gujarat", "Maharashtra"]
growth = [342239, 94163, 308245, 196024, 307713]
df = pd.DataFrame({"State": State,
"Growth": growth})
df.sort_values('Growth')
sns.barplot(x='State',
y="Growth", data=df,
order=df.sort_values('Growth').State)
|
Output:
Example 2
Python3
import pandas as pd
import numpy as np
import matplotlib.pyplot as plt
import seaborn as sns
State = ["Rajasthan", "Bihar", "Madhya Pradesh",
"Gujarat", "Maharashtra"]
growth = [342239, 94163, 308245, 196024, 307713]
df = pd.DataFrame({"State": State,
"Growth": growth})
df.sort_values('Growth')
sns.barplot(x='State',
y="Growth", data=df,
order=df.sort_values('Growth',ascending = False).State)
|
Output:
Share your thoughts in the comments
Please Login to comment...