Python – seaborn.swarmplot() method
Last Updated :
18 Aug, 2020
Prerequisite : Fundamentals of Seaborn
Seaborn is a Python data visualization library based on matplotlib. It provides a high-level interface for drawing attractive and informative statistical graphics. There is just something extraordinary about a well-designed visualization. The colors stand out, the layers blend nicely together, the contours flow throughout, and the overall package not only has a nice aesthetic quality, but it provides meaningful insights to us as well.
seaborn.swarmplot()
Draw a categorical scatterplot with non-overlapping points. A swarm plot can be drawn on its own, but it is also a good complement to a box or violin plot in cases where you want to show all observations along with some representation of the underlying distribution. Arranging the points properly requires an accurate transformation between data and point coordinates. This means that non-default axis limits must be set *before* drawing the plot.
Syntax : seaborn.swarmplot(parameters)
Parameters :
- x, y, hue : Inputs for plotting long-form data.
- data : Dataset for plotting.
- order, hue_order : Order to plot the categorical levels in, otherwise the levels are inferred from the data objects.
- dodge : To separate the strips for different hue levels along the categorical axis
- orient : Orientation of the plot (vertical or horizontal).
- color : Color for all of the elements, or seed for a gradient palette.
- palette : Colors to use for the different levels of the hue variable.
- size : Radius of the markers, in points.
- edgecolor : Color of the lines around each point.
- linewidth : Width of the gray lines that frame the plot elements.
- ax : Axes object to draw the plot onto, otherwise uses the current Axes.
- kwargs : Other keyword arguments
Returns : Returns the Axes object with the plot drawn onto it.
Below is the implementation of above method with some examples :
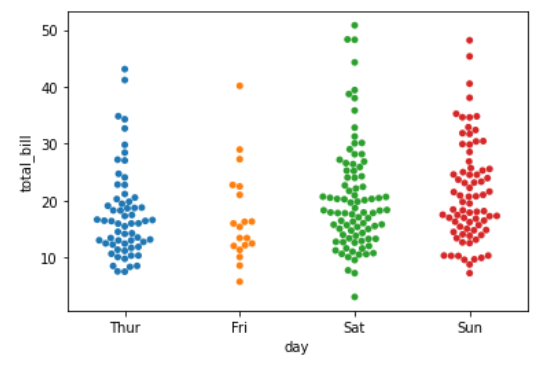
Example 1 :
import seaborn as sns
import matplotlib.pyplot as plt
data = sns.load_dataset("tips")
sns.swarmplot(x ="day", y = "total_bill",
data = data, size = 5)
plt.show()
|
Output :
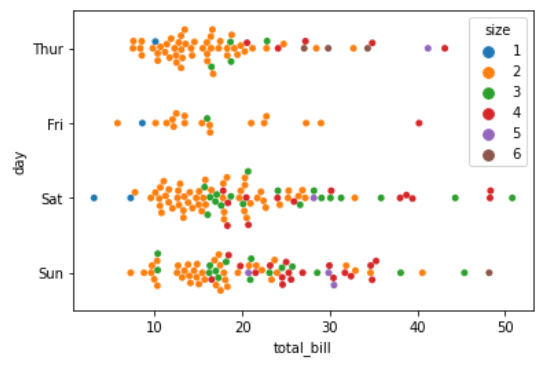
Example 2 :
import seaborn as sns
import matplotlib.pyplot as plt
data = sns.load_dataset("tips")
sns.swarmplot(y = "day", x = "total_bill", hue = "size",
orient = "h", data = data)
plt.show()
|
Output :
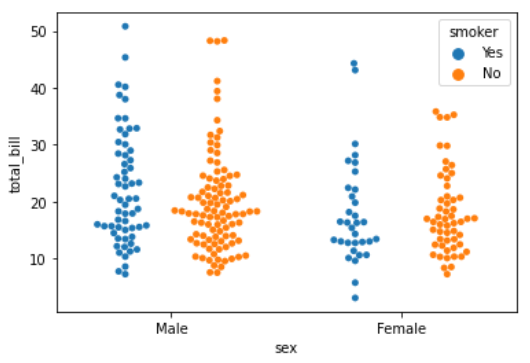
Example 3 :
import seaborn as sns
import matplotlib.pyplot as plt
data = sns.load_dataset("tips")
sns.swarmplot(x = "sex", y = "total_bill", hue = "smoker",
data = data, dodge = True)
plt.show()
|
Output :
Share your thoughts in the comments
Please Login to comment...