How To Manually Order Boxplot in Seaborn?
Last Updated :
04 Oct, 2021
Seaborn is an amazing visualization library for statistical graphics plotting in Python. It provides beautiful default styles and color palettes to make statistical plots more attractive. It is built on the top of matplotlib library and also closely integrated into the data structures from pandas.
Seaborn aims to make visualization of the central part of exploring and understanding data. It provides dataset-oriented APIs, so that we can switch between different visual representations for the same variables for a better understanding of the dataset.
Box Plot is the visual representation of the depicting groups of numerical data through their quartiles. Boxplot is also used for detecting the outlier in the data set. It captures the summary of the data efficiently with a simple box and whiskers and allows us to compare easily across groups. Boxplot summarizes sample data using 25th, 50th, and 75th percentiles. These percentiles are also known as the lower quartile, median and upper quartile.
In this article, we will discuss how to order a boxplot manually.
Dataset Used
The dataset used in the below example is https://www.kaggle.com/ranjeetjain3/seaborn-tips-dataset
Step-by-step Approach:
Python3
import pandas as pd
import numpy as np
import matplotlib.pyplot as plt
import seaborn as sns
|
Python3
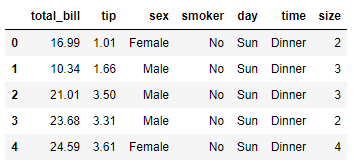
tips= sns.load_dataset('tips')
tips.head()
|
Output:
Python3
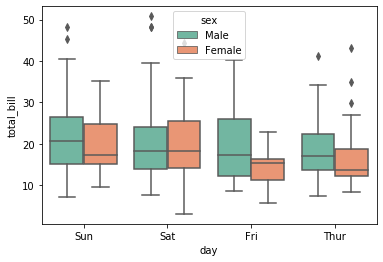
fx = sns.boxplot(x='day', y='total_bill', data=tips, hue='sex', palette='Set2')
|
Output:
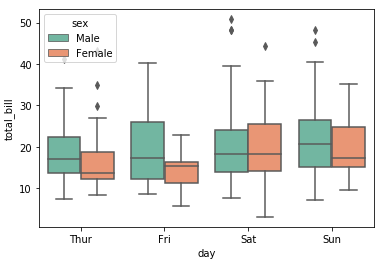
- Plotting the boxplot using seaborn. See the difference in the order of the above figure and after setting the order as per our needs. Palette will change the color of the graph (you can try Set1 and Set3 as well)
Python3
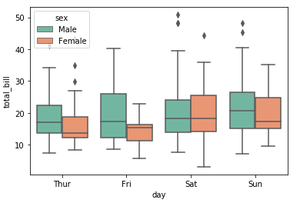
fx = sns.boxplot(x='day', y='total_bill', data=tips, order=[
'Sun', 'Sat', 'Fri', 'Thur'], hue='sex', palette='Set2')
|
Output:

Below is the complete program based on the above approach:
Example 1
Python3
import pandas as pd
import numpy as np
import matplotlib.pyplot as plt
import seaborn as sns
tips= sns.load_dataset('tips')
tips.head()
sns.boxplot(x='day', y='total_bill', data=tips, order=[
'Sun', 'Sat', 'Fri', 'Thur'], hue='sex', palette='Set2')
|
Output:
Example 2
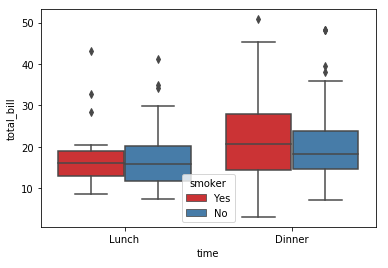
Now, Plotting the boxplot using different features. Observe the order on the x-axis in the figure given below:
Python3
import pandas as pd
import numpy as np
import matplotlib.pyplot as plt
import seaborn as sns
tips = sns.load_dataset('tips')
tips.head()
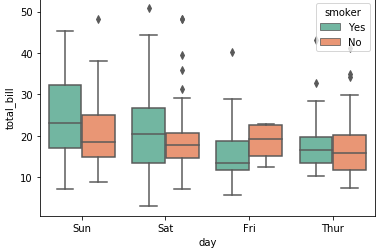
fx = sns.boxplot(x="time", y="total_bill", hue="smoker",
data=tips, palette="Set1")
ax = sns.boxplot(x="time", y="total_bill", hue="smoker", order=['Dinner', 'Lunch'],
data=tips, palette="Set1")
|
Output:
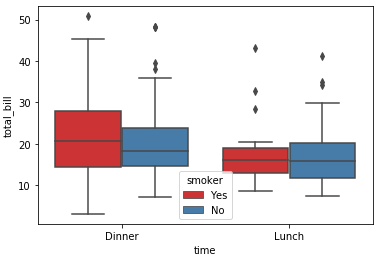
Here we have manually ordered the boxplot.
Like Article
Suggest improvement
Share your thoughts in the comments
Please Login to comment...