Python – seaborn.factorplot() method
Last Updated :
07 Apr, 2022
Seaborn is an amazing visualization library for statistical graphics plotting in Python. It provides beautiful default styles and color palettes to make statistical plots more attractive. It is built on the top of matplotlib library and also closely integrated to the data structures from pandas.
seaborn.factorplot() method
seaborn.factorplot() method is used to draw a categorical plot onto a FacetGrid.
Syntax : seaborn.factorplot(x=None, y=None, hue=None, data=None, row=None, col=None, col_wrap=None, estimator=, ci=95, n_boot=1000, units=None, seed=None, order=None, hue_order=None, row_order=None, col_order=None, kind=’strip’, height=5, aspect=1, orient=None, color=None, palette=None, legend=True, legend_out=True, sharex=True, sharey=True, margin_titles=False, facet_kws=None, **kwargs) Parameters : This method is accepting the following parameters that are described below:
- x, y : This parameter take names of variables in data, Inputs for plotting long-form data.
- hue : (optional)This parameter take column name for colour encoding
- data : This parameter take DataFrame, Long-form (tidy) dataset for plotting. Each column should correspond to a variable, and each row should correspond to an observation.
- row, col : (optional) This parameter take names of variables in data, Categorical variables that will determine the faceting of the grid.
- col_wrap : (optional) This parameter take integer value, “Wrap” the column variable at this width, so that the column facets span multiple rows. Incompatible with a row facet.
- estimator : (optional) This parameter take callable that maps vector -> scalar, Statistical function to estimate within each categorical bin.
- ci : (optional) This parameter take float or “sd” or None value, Size of confidence intervals to draw around estimated values. If “sd”, skip bootstrapping and draw the standard deviation of the observations. If None, no bootstrapping will be performed, and error bars will not be drawn.
- n_boot : (optional) This parameter take integer value, Number of bootstrap iterations to use when computing confidence intervals.
- units : (optional) This parameter take name of variable in data or vector data, Identifier of sampling units, which will be used to perform a multilevel bootstrap and account for repeated measures design.
- seed : (optional) This parameter take integer value, numpy.random.Generator, or numpy.random.RandomState, Seed or random number generator for reproducible bootstrapping.
- order, hue_order : (optional) This parameter take lists of strings, Order to plot the categorical levels in, otherwise the levels are inferred from the data objects.
- row_order, col_order: (optional) This parameter take lists of strings, Order to organize the rows and/or columns of the grid in, otherwise the orders are inferred from the data objects.
- kind : (optional) This parameter take string value, The kind of plot to draw (corresponds to the name of a categorical plotting function. Options are: “point”, “bar”, “strip”, “swarm”, “box”, “violin”, or “boxen”.
- height : (optional) This parameter take float value, Height (in inches) of each facet.
- aspect : (optional) This parameter take float value, Aspect ratio of each facet, so that aspect * height gives the width of each facet in inches.
- orient : (optional) This parameter take value that should be “v” | “h”, Orientation of the plot (vertical or horizontal). This is usually inferred from the dtype of the input variables, but can be used to specify when the “categorical” variable is a numeric or when plotting wide-form data.
- color : (optional) This parameter take matplotlib color, Color for all of the elements, or seed for a gradient palette.
- palette : (optional) This parameter take palette name, list, or dict, Colors to use for the different levels of the hue variable. Should be something that can be interpreted by color_palette(), or a dictionary mapping hue levels to matplotlib colors.
- legend : (optional) This parameter take boolean value, If True and there is a hue variable, draw a legend on the plot.
- legend_out : (optional) This parameter take boolean value, If True, the figure size will be extended, and the legend will be drawn outside the plot on the center right.
- share{x, y} : (optional) This parameter take bool, ‘col’, or ‘row’, If true, the facets will share y axes across columns and/or x axes across rows.
- margin_titles : (optional) This parameter take boolean value, If True, the titles for the row variable are drawn to the right of the last column. This option is experimental and may not work in all cases.
- facet_kws : (optional) This parameter take dictionary object, Dictionary of other keyword arguments to pass to FacetGrid.
- kwargs : This parameter take key, value pairings, Other keyword arguments are passed through to the underlying plotting function.
Returns : This method returns the FacetGrid object with the plot on it for further tweaking.
Note: For downloading the Tips dataset Click Here. Below examples illustrate the factorplot() method of the seaborn library. Example 1 :
Python3
import pandas as pd
import seaborn as sns
import matplotlib.pyplot as plt
df = pd.read_csv('Tips.csv')
sns.factorplot(x ='size', y ='tip', data = df)
plt.show()
|
Output : 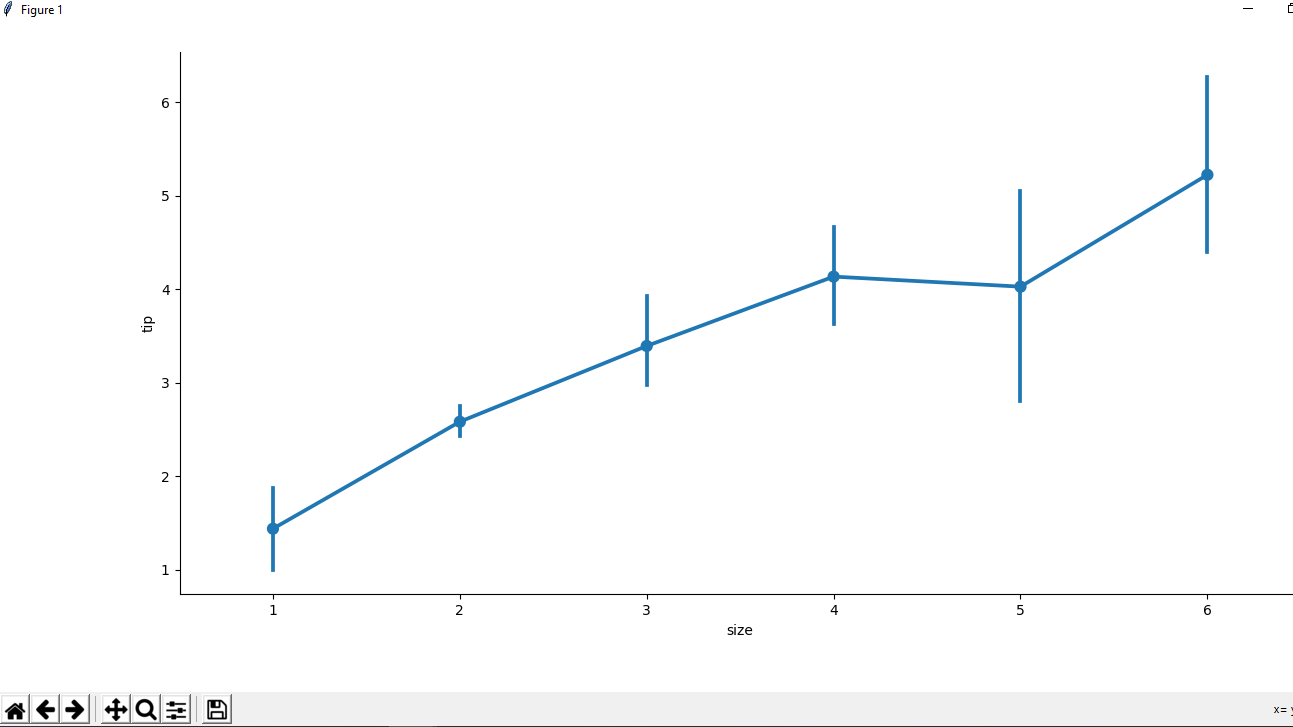 Example 2 :
Python3
import pandas as pd
import seaborn as sns
import matplotlib.pyplot as plt
df = pd.read_csv('Tips.csv')
sns.factorplot(x ='size', y ='tip',
hue = 'sex', data = df)
plt.show()
|
Output : 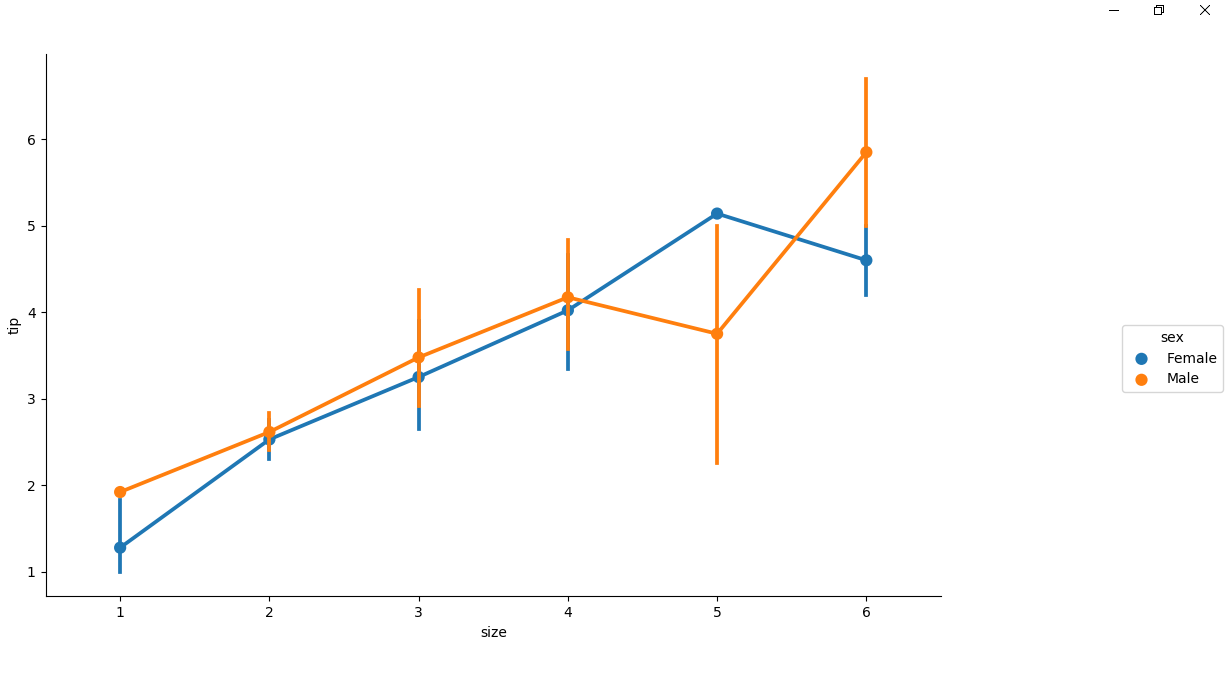
Share your thoughts in the comments
Please Login to comment...