Matplotlib.pyplot.violinplot() in Python
Last Updated :
21 Apr, 2020
Matplotlib is an amazing visualization library in Python for 2D plots of arrays. Matplotlib is a multi-platform data visualization library built on NumPy arrays and designed to work with the broader SciPy stack.
Matplotlib.pyplot.violinplot()
The matplotlib.pyplot.violinplot() is as the name explains is used for making violin plots. Through this function, you can make a violin plot for every column of the dataset or each vector in the dataset sequence. All filled areas extend to show the entire data range with lines that are optional at the mean, the median, the maximum and the minimum.
Syntax: matplotlib.pyplot.violinplot(dataset, positions=None, vert=True, widths=0.5, showmeans=False, showextrema=True, showmedians=False, points=100, bw_method=None, *, data=None)
Parameters:
- dataset: It is a required parameter that is generally an array or a sequence of vectors. This is where the data is fed to the function.
- positions: it is an array-like object whose default value is an array from 1 to n (ie, default = [1, 2, 3…n]). It is used to set the violins position. The limits and ticks are set automatically to match the positions.
- vert: This parameter accepts a boolean value. The default for this parameter is False. If set to True it creates a vertical violin plot else sets a horizontal violin plot.
- widths: It accepts an array-like object and has a default value of 0.5. It is used to set the maximal width of each violin and can be a scalar or a vector. If default value is used it takes about half the horizontal space.
- showmeans: it accepts a boolean value and has the default set as False. if set to true it toggles rendering of the mean
- showextreama: It accepts a boolean value and by default is set to False. if set True, it toggles rendering of the extrema.
- showmedians: It accepts a boolean value and has default set to False. If set True, it toggles the rendering of the medians.
- points:It accepts a scalar and has a default value of 100. it is used to define the total number of points to calculate every gaussian kernel density estimations.
- bw_method: It is an optional parameter that accepts a string, scalar or a callable. The estimator bandwidth is calculated using this method. It can be ‘silverman’, ‘scott’, a callable or a scalar constant. In case of scalar, it is used directly as kde.factor. If it is a callable then it takes GaussianKDE instance only and returns a scalar. Scott is used in case None
Returns: This function returns a dictionary mapping of each component of the violin-plot to a list of respective collection instances. the dictionary returned has the following keys:
- bodies: AN instance list of matplotlib.collections.PolyCollection containing the filled area of every violin.
- cmeans: An instance of matplotlib.collections.LineCollection is created to identify the mean of each violin distribution
- cmins: An instance of matplotlib.collections.LineCollection created to identify the bottom of each violin distribution.
- cmaxes: An instance of matplotlib.collections.LineCollection created to identify the top of each violin distribution.
- cbars:An instance of matplotlib.collections.LineCollection created to identify the center of each violin distribution.
- cmedians:An instance of matplotlib.collections.LineCollection created to identify the mean value of each violin distribution.
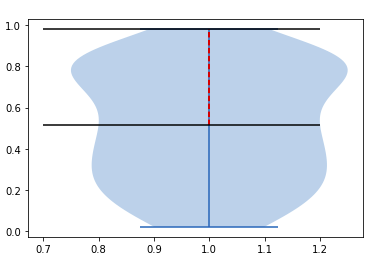
Example 1:
import numpy as np
import matplotlib.pyplot as plt
np.random.seed(21)
data = np.random.random(111)
quartile1, median, quartile3 = np.percentile(data,
[ 50, 75,100],
axis=0)
plt.violinplot(data)
plt.vlines(1, quartile1,
quartile3,
color='r',
linestyle='--')
plt.hlines(quartile1,.7,1.2)
plt.hlines(quartile3,.7,1.2)
|
Output:
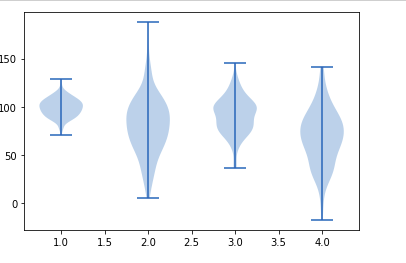
Example 2:
import matplotlib.pyplot as plt
np.random.seed(15437660)
coll_1 = np.random.normal(100, 10, 200)
coll_2 = np.random.normal(80, 30, 200)
coll_3 = np.random.normal(90, 20, 200)
coll_4 = np.random.normal(70, 25, 200)
data_plotter = [coll_1, coll_2,
coll_3, coll_4]
plt.violinplot(data_plotter)
plt.show()
|
Output:
Share your thoughts in the comments
Please Login to comment...