How to Display an OpenCV image in Python with Matplotlib?
Last Updated :
03 Jan, 2023
The OpenCV module is an open-source computer vision and machine learning software library. It is a huge open-source library for computer vision, machine learning, and image processing. OpenCV supports a wide variety of programming languages like Python, C++, Java, etc. It can process images and videos to identify objects, faces, or even the handwriting of a human. When it is integrated with various libraries, such as numpy which is a highly optimized library for numerical operations, then the number of weapons increases in your Arsenal i.e whatever operations one can do in Numpy can be combined with OpenCV.
First, let’s look at how to display images using OpenCV:
Now there is one function called cv2.imread() which will take the path of an image as an argument. Using this function you will read that particular image and simply display it using the cv2.imshow() function.
Python3
import cv2
image = cv2.imread('gfg.png')
cv2.imshow('GFG', image)
|
Output:

DIsplay image using OpenCV
Now let’s jump into displaying the images with Matplotlib module. It is an amazing visualization library in Python for 2D plots of arrays. The Matplotlib module is a multi-platform data visualization library built on NumPy arrays and designed to work with the broader SciPy stack.
We are doing minor changes to the above code to display our image with Matplotlib module.
Python3
import cv2
import matplotlib.pyplot as plt
image = cv2.imread('gfg.png')
plt.imshow(image)
plt.show()
|
Output:
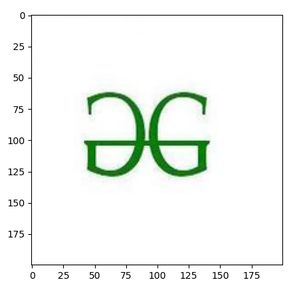
image plot with Matplotlib
One can also display gray scale OpenCV images with Matplotlib module for that you just need to convert colored image into a gray scale image.
Python3
import cv2
import matplotlib.pyplot as plt
image = cv2.imread('gfg.png')
img1 = cv2.cvtColor(image, cv2.COLOR_RGB2GRAY)
plt.imshow(img1, cmap='gray')
plt.show()
|
Output:

Display grayscale image plot with Matplotlib
This is how we can display OpenCV images in python with Matplotlib module.
Share your thoughts in the comments
Please Login to comment...