How to Draw Rectangle on Image in Matplotlib?
Last Updated :
17 Dec, 2020
Prerequisites: Matplotlib
Given an image the task here is to draft a python program using matplotlib to draw a rectangle on it. Matplotlib comes handy with rectangle() function which can be used for our requirement.
Syntax: Rectangle(xy, width, height, angle=0.0, **kwargs)
Parameters:
- xy: Lower left point to start the rectangle plotting
- width : width of the rectangle
- height: Height of the rectangle.
- angle: Angle of rotation of the rectangle.
Approach
- Import the necessary libraries.
- Insert and display the image.
- Create the figure and axes of the plot
- Add the patch to the Axes
- Display the image
Example 1: Draw a rectangle on an image
Python3
import matplotlib.pyplot as plt
import matplotlib.patches as patches
from PIL import Image
import numpy as np
x = np.array(Image.open('geek.png'), dtype=np.uint8)
plt.imshow(x)
fig, ax = plt.subplots(1)
ax.imshow(x)
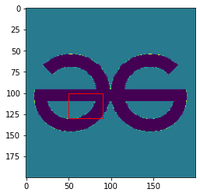
rect = patches.Rectangle((50, 100), 40, 30, linewidth=1,
edgecolor='r', facecolor="none")
ax.add_patch(rect)
plt.show()
|
Output:

original image

image with rectangle
Example 2: Draw a filled rectangle
Python3
import matplotlib.pyplot as plt
import matplotlib.patches as patches
from PIL import Image
import numpy as np
x = np.array(Image.open('geek.png'), dtype=np.uint8)
plt.imshow(x)
fig, ax = plt.subplots(1)
ax.imshow(x)
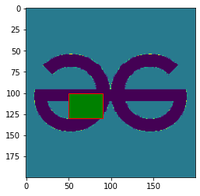
rect = patches.Rectangle((50, 100), 40, 30, linewidth=1,
edgecolor='r', facecolor="g")
ax.add_patch(rect)
plt.show()
|
Output:

original image

image with rectangle
Like Article
Suggest improvement
Share your thoughts in the comments
Please Login to comment...