How to set the spacing between subplots in Matplotlib in Python?
Last Updated :
15 Sep, 2022
In this article, we will see how to set the spacing between subplots in Matplotlib in Python. Let’s discuss some concepts :
- Matplotlib : Matplotlib is an amazing visualization library in Python for 2D plots of arrays. Matplotlib is a multi-platform data visualization library built on NumPy arrays and designed to work with the broader SciPy stack. It was introduced by John Hunter in the year 2002.
- Subplots : The subplots() function in pyplot module of matplotlib library is used to create a figure and a set of subplots. Subplots are required when we want to show two or more plots in same figure.
Here, first we will see why setting of space is required.
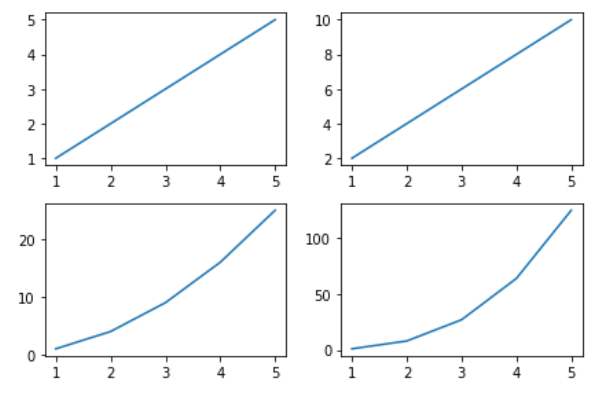
Python3
import numpy as np
import matplotlib.pyplot as plt
x=np.array([1, 2, 3, 4, 5])
fig, ax = plt.subplots(2, 2)
ax[0, 0].plot(x, x)
ax[0, 1].plot(x, x*2)
ax[1, 0].plot(x, x*x)
ax[1, 1].plot(x, x*x*x)
plt.show()
|
Output:

Too much congested and very confusing
Set the spacing between subplots
As, we can see that the above figure axes values are too congested and very confusing. To solve this problem we need to set the spacing between subplots.
Steps Needed
- Import Libraries
- Create/ Load data
- Make subplot
- Plot subplot
- Set spacing between subplots.
Using tight_layout() method to set the spacing between subplots
The tight_layout() method automatically maintains the proper space between subplots.
Example 1: Without using pad
Python3
fig.tight_layout()
plt.show()
|
Output:
set the spacing between subplots in Matplotlib
Example 2: Using pad
Python3
fig.tight_layout(pad=5.0)
plt.show()
|
Output:

set the spacing between subplots in Matplotlib
Using subplots_adjust() method to set the spacing between subplots
We can use the plt.subplots_adjust() method to change the space between Matplotlib subplots. The parameters wspace and hspace specify the space reserved between Matplotlib subplots. They are the fractions of axis width and height, respectively. And the parameters left, right, top and bottom parameters specify four sides of the subplots’ positions. They are the fractions of the width and height of the figure.
Python3
plt.subplots_adjust(left=0.1,
bottom=0.1,
right=0.9,
top=0.9,
wspace=0.4,
hspace=0.4)
plt.show()
|
Output:
Using subplots_tool() method to set the spacing between subplots
This method launches a subplot tool window for a figure. It provides an interactive method for the user to drag the bar in the subplot_tool to change the subplots’ layout.
Python3
plt.subplot_tool()
plt.show()
|
Output:
Using constrained_layout() to set the spacing between subplots
Here we are using the constrained_layout=True to set the spacing between the subplots in Matplotlib.
Python3
fig, ax = plt.subplots(2, 2,
constrained_layout = True)
ax[0, 0].plot(x, x)
ax[0, 1].plot(x, x*2)
ax[1, 0].plot(x, x*x)
ax[1, 1].plot(x, x*x*x)
plt.show()
|
Output:
Share your thoughts in the comments
Please Login to comment...