Hide Axis, Borders and White Spaces in Matplotlib
Last Updated :
11 Dec, 2020
When we draw plots using Matplotlib, the ticks and labels along x-axis & y-axis are drawn too. For drawing creative graphs, many times we hide x-axis & y-axis.
How to hide axis in matplotlib figure?
The matplotlib.pyplot.axis(‘off’) command us used to hide the axis(both x-axis & y-axis) in the matplotlib figure.
Example:
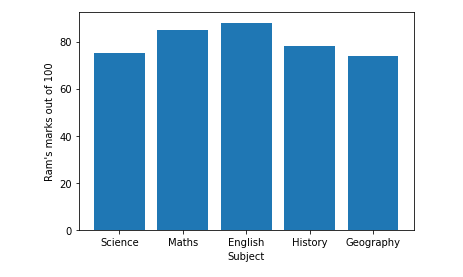
Let us consider the following figure in which we have to hide the axis.
Python3
import numpy as np
import matplotlib.pyplot as plt
x = ['Science', 'Maths', 'English', 'History', 'Geography']
y = [75, 85, 88, 78, 74]
plt.bar(x, y)
plt.xlabel("Subject")
plt.ylabel("Ram's marks out of 100")
plt.show()
|
Output:
Example:
Hiding the axis in the above figure.
Python3
import numpy as np
import matplotlib.pyplot as plt
x = ['Science', 'Maths', 'English', 'History', 'Geography']
y = [75, 85, 88, 78, 74]
plt.xlabel("Subject")
plt.ylabel("Ram's marks out of 100")
plt.bar(x, y)
plt.axis('off')
plt.show()
|
Output:

If we just want to turn either the X-axis or Y-axis off, we can use plt.xticks( ) or plt.yticks( ) method respectively.
Example:
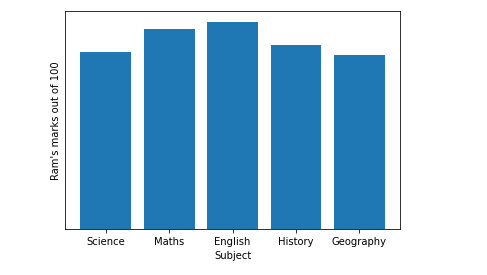
Hiding Y-axis
Python3
import numpy as np
import matplotlib.pyplot as plt
x = ['Science', 'Maths', 'English', 'History', 'Geography']
y = [75, 85, 88, 78, 74]
plt.bar(x, y)
plt.xlabel("Subject")
plt.ylabel("Ram's marks out of 100")
plt.yticks([])
plt.show()
|
Output:
Example:
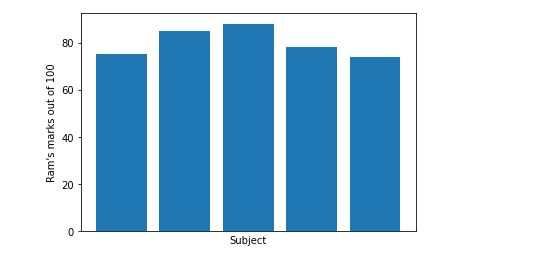
Hiding X-axis
Python3
import numpy as np
import matplotlib.pyplot as plt
x = ['Science', 'Maths', 'English', 'History', 'Geography']
y = [75, 85, 88, 78, 74]
plt.bar(x, y)
plt.xlabel("Subject")
plt.ylabel("Ram's marks out of 100")
plt.xticks([])
plt.show()
|
Output:
Hiding the Whitespaces and Borders in the Matplotlib figure
When we use plt.axis(‘off’) command it hides the axis, but we get whitespaces around the image’s border while saving it. To remove/hide whitespace around the border, we can set bbox_inches=’tight’ in the savefig() method.
Similarly, to remove the white border around the image while we set pad_inches = 0 in the savefig() method.
Example:
Python3
import numpy as np
import matplotlib.pyplot as plt
x = ['Science', 'Maths', 'English', 'History', 'Geography']
y = [75, 85, 88, 78, 74]
fig = plt.bar(x, y)
plt.xlabel("Subject")
plt.ylabel("Ram's marks out of 100")
plt.axis('off')
plt.savefig('image.png', bbox_inches='tight', pad_inches=0)
plt.show()
|
Output:
Note: If you have noticed that when we use plt.axis(‘off’) it automatically hides the Axis, Whitespaces and Borders.
Share your thoughts in the comments
Please Login to comment...