Plot Multiple lines in Matplotlib
Last Updated :
25 Nov, 2020
In this article, we will learn how to plot multiple lines using matplotlib in Python. Let’s discuss some concepts:
- Matplotlib: Matplotlib is an amazing visualization library in Python for 2D plots of arrays. Matplotlib is a multi-platform data visualization library built on NumPy arrays and designed to work with the broader SciPy stack. It was introduced by John Hunter in the year 2002.
- Line plot: Line plots can be created in Python with Matplotlib’s pyplot library. To build a line plot, first import Matplotlib. It is a standard convention to import Matplotlib’s pyplot library as plt. The plt alias will be familiar to other Python programmers.
Here we will discuss some examples to draw a line or multiple lines with different features. To do such work we must follow the steps given below:
- Import libraries.
- Create Data.
- Plot the lines over data.
Plotting a single Horizontal Line
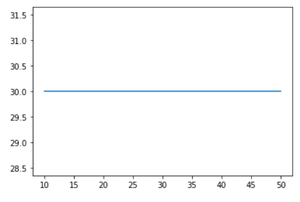
In this example, we will learn how to draw a horizontal line with the help of matplotlib. Here we will use two lists as data for two dimensions (x and y) and at last plot the line. For making a horizontal line we have to change the value of the x-axis continuously by taking the y-axis as constant.
Python3
import matplotlib.pyplot as plt
x = [10,20,30,40,50]
y = [30,30,30,30,30]
plt.plot(x, y)
plt.show()
|
Output:
Plotting a single Vertical Line
In this example, we will learn how to draw a vertical line with the help of matplotlib. Here we will use two lists as data with two dimensions (x and y) and at last plot the line. For making a vertical line we have to change the value of the y-axis continuously by taking the x-axis as constant. So we change the axes to get a vertical line.
Python3
import matplotlib.pyplot as plt
x = [10,20,30,40,50]
y = [30,30,30,30,30]
plt.plot(y,x)
plt.show()
|
Output:

Plotting a Horizontal and a Vertical Line
In this example, we will learn how to draw a horizontal line and a vertical line both in one graph with the help of matplotlib. Here we will use two list as data with two dimensions (x and y) and at last plot the line with respect to the dimensions. So, in this example we merge the above both graphs to make both lines together in a graph.
Python3
import matplotlib.pyplot as plt
x = [10,20,30,40,50]
y = [30,30,30,30,30]
plt.plot(x, y, label = "line 1")
plt.plot(y, x, label = "line 2")
plt.legend()
plt.show()
|
Output:

Plotting Multiple Lines
In this example, we will learn how to draw multiple lines with the help of matplotlib. Here we will use two lists as data with two dimensions (x and y) and at last plot the lines as different dimensions and functions over the same data.
To draw multiple lines we will use different functions which are as follows:
- y = x
- x = y
- y = sin(x)
- y = cos(x)
Python3
import matplotlib.pyplot as plt
import numpy as np
x = [1,2,3,4,5]
y = [3,3,3,3,3]
plt.plot(x, y, label = "line 1")
plt.plot(y, x, label = "line 2")
plt.plot(x, np.sin(x), label = "curve 1")
plt.plot(x, np.cos(x), label = "curve 2")
plt.legend()
plt.show()
|
Output:

Plotting Multiple Lines with different Line styles
This example is similar to the above example and the enhancement is the different line styles. This can help in the modification of better visualization.
Here we will use different line styles which are as follows:
- – : dashed
- — : double dashed
- -. : dashed-dotted
- : : dotted
Python3
import matplotlib.pyplot as plt
import numpy as np
x = [1,2,3,4,5]
y = [3,3,3,3,3]
plt.plot(x, y, label = "line 1", linestyle="-")
plt.plot(y, x, label = "line 2", linestyle="--")
plt.plot(x, np.sin(x), label = "curve 1", linestyle="-.")
plt.plot(x, np.cos(x), label = "curve 2", linestyle=":")
plt.legend()
plt.show()
|
Output:

Share your thoughts in the comments
Please Login to comment...