Surface plots and Contour plots in Python
Last Updated :
22 Jun, 2020
Matplotlib was introduced keeping in mind, only two-dimensional plotting. But at the time when the release of 1.0 occurred, the 3d utilities were developed upon the 2d and thus, we have 3d implementation of data available today! The 3d plots are enabled by importing the mplot3d toolkit. In this article, we will discuss the surface plots and contour plots in detail.
Surface plots
A Surface Plot is a representation of a three-dimensional dataset. It describes a functional relationship between two independent variables X and Z and a designated dependent variable Y, rather than showing the individual data points. It is a companion plot of the contour plot. It is similar to the wireframe plot, but each face of the wireframe is a filled polygon. This helps to create the topology of the surface which is being visualized.
Surface plots are used to :
- Visualise loss functions in machine learning and deep learning
- Visualise store or state value functions in reinforcement learning
Creating 3D surface Plot
The axes3d present in Matplotlib’s mpl_toolkits.mplot3d toolkit provides the necessary functions used to create 3D surface plots.Surface plots are created by using ax.plot_surface() function.
Syntax:
ax.plot_surface(X, Y, Z)
where X and Y are 2D arrays of points of x and y while Z is a 2D array of heights.
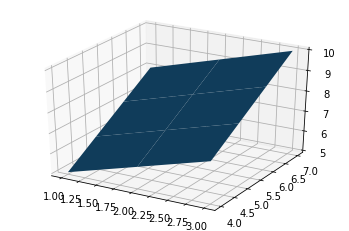
Example 1:
import numpy as np
import pandas as pd
import matplotlib.pyplot as plt
from mpl_toolkits.mplot3d import Axes3D
a = np.array([1, 2, 3])
b = np.array([4, 5, 6, 7])
a, b = np.meshgrid(a, b)
fig = plt.figure()
axes = fig.gca(projection ='3d')
axes.plot_surface(a, b, a + b)
plt.show()
|
Output:
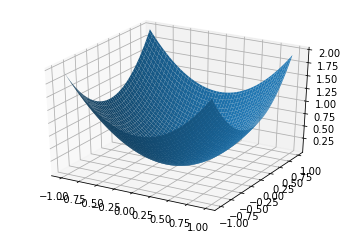
Example 2:
import numpy as np
import pandas as pd
import matplotlib.pyplot as plt
from mpl_toolkits.mplot3d import Axes3D
a = np.array([1, 2, 3])
b = np.array([4, 5, 6, 7])
a, b = np.meshgrid(a, b)
a = np.arange(-1, 1, 0.02)
b = a
a, b = np.meshgrid(a, b)
fig = plt.figure()
axes = fig.gca(projection ='3d')
axes.plot_surface(a, b, a**2 + b**2)
plt.show()
|
Countour plots
Contour plots also called level plots are a tool for doing multivariate analysis and visualizing 3-D plots in 2-D space. If we consider X and Y as our variables we want to plot then the response Z will be plotted as slices on the X-Y plane due to which contours are sometimes referred to as Z-slices or iso-response.
Contour plots are widely used to visualize density, altitudes, or heights of the mountain as well as in the meteorological department. Due to such wide usage matplotlib.pyplot provides a method contour to make it easy for us to draw contour plots.
Creating Contour plots
The matplotlib.pyplot.contour() are usually useful when Z = f(X, Y) i.e Z changes as a function of input X and Y. A contourf() is also available which allows us to draw filled contours.
Syntax:
matplotlib.pyplot.contour([X, Y, ] Z, [levels], **kwargs)
where,
- X, Y: 2-D NumPy arrays with the same shape as Z or 1-D arrays such that
len(X)==M and len(Y)==N (where M and N are rows and columns of Z)
Z: The height values over which the contour is drawn. The shape is (M, N)
levels: Determines the number and positions of the contour lines/regions.
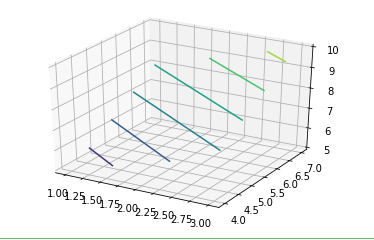
Example 1:
import numpy as np
import pandas as pd
import matplotlib.pyplot as plt
from mpl_toolkits.mplot3d import Axes3D
a = np.array([1, 2, 3])
b = np.array([4, 5, 6, 7])
a, b = np.meshgrid(a, b)
fig = plt.figure()
axes = fig.gca(projection ='3d')
axes.contour(a, b, a + b)
plt.show()
|
Output:
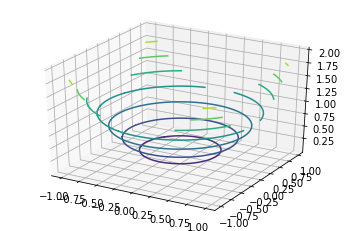
Example 2:
import numpy as np
import pandas as pd
import matplotlib.pyplot as plt
from mpl_toolkits.mplot3d import Axes3D
a = np.array([1, 2, 3])
b = np.array([4, 5, 6, 7])
a, b = np.meshgrid(a, b)
a = np.arange(-1, 1, 0.02)
b = a
a, b = np.meshgrid(a, b)
fig = plt.figure()
axes = fig.gca(projection ='3d')
axes.contour(a, b, a**2 + b**2)
plt.show()
|
Output:
Share your thoughts in the comments
Please Login to comment...