Plotting back-to-back bar charts Matplotlib
Last Updated :
16 Dec, 2021
In this article, we will learn how to plot back-to-back bar charts in matplotlib in python. Let’s discuss some concepts :
Matplotlib: Matplotlib is an amazing visualization library in Python for 2D plots of arrays. Matplotlib is a multi-platform data visualization library built on NumPy arrays and designed to work with the broader SciPy stack. It was introduced by John Hunter in the year 2002.
Bar chart: Bar plot or Bar chart is a graph that represents the category of data with rectangular bars with lengths and heights that is proportional to the values which they represent. The bar plots can be plotted horizontally or vertically.
Back-to-Back Bar Chart: Back-to-Back Bar Chart is just a combination of two bar charts drawn with respect to a axis.
Steps Needed
- Import library (matplotlib)
- Import / Load / Create data
- Plot the Back-to-Back Bar Chart over data.
Here, we discuss some examples step by step to understand the concept in a better way.
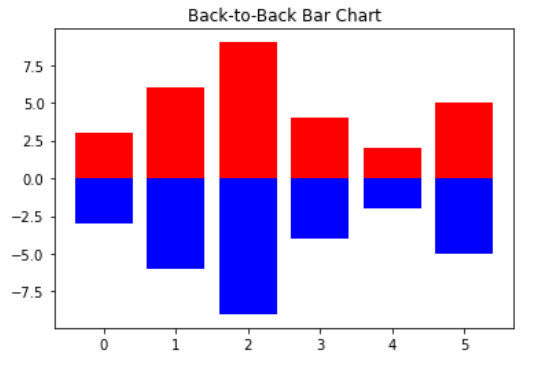
Example 1: Simple Back-to-Back Bar Chart
Python3
import numpy as np
import matplotlib.pyplot as plt
A = np.array([3,6,9,4,2,5])
X = np.arange(6)
plt.bar(X, A, color = 'r')
plt.bar(X, -A, color = 'b')
plt.title("Back-to-Back Bar Chart")
plt.show()
|
Output :
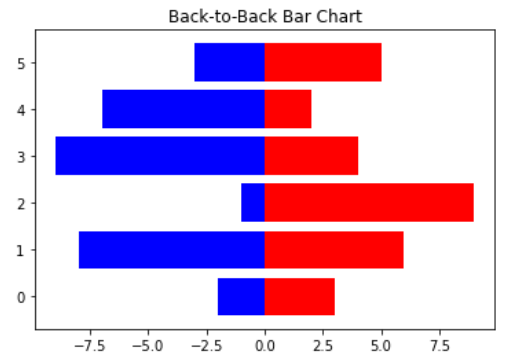
Example 2: Horizontal Back-to-Back Bar Chart.
Python3
import numpy as np
import matplotlib.pyplot as plt
A = np.array([3,6,9,4,2,5])
B = np.array([2,8,1,9,7,3])
X = np.arange(6)
plt.barh(X, A, color = 'r')
plt.barh(X, -B, color = 'b')
plt.title("Back-to-Back Bar Chart")
plt.show()
|
Output :
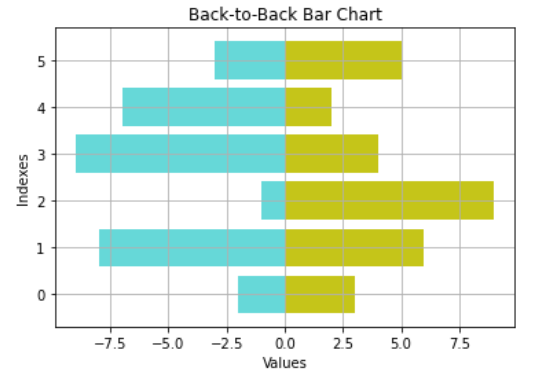
Example 3: Complete Back-to-Back Bar Chart with Some styles in matplotlib.
Python3
import numpy as np
import matplotlib.pyplot as plt
A = np.array([3,6,9,4,2,5])
B = np.array([2,8,1,9,7,3])
X = np.arange(6)
plt.barh(X, A, align='center',
alpha=0.9, color = 'y')
plt.barh(X, -B, align='center',
alpha=0.6, color = 'c')
plt.grid()
plt.title("Back-to-Back Bar Chart")
plt.ylabel("Indexes")
plt.xlabel("Values")
plt.show()
|
Output :
Share your thoughts in the comments
Please Login to comment...