How to add a legend to a scatter plot in Matplotlib ?
Last Updated :
10 Nov, 2021
In this article, we are going to add a legend to the depicted images using matplotlib module. We will use the matplotlib.pyplot.legend() method to describe and label the elements of the graph and distinguishing different plots from the same graph.
Syntax: matplotlib.pyplot.legend( [“title_1”, “Title_2”], ncol = 1 , loc = “upper left” ,bbox_to_anchor =(1, 1) )
Parameters :
- ncol: [takes int, optional parameter] the default value is 1. It represents the number of columns in legend.
- loc: [takes string, optional parameter] the default value is “best” i.e “upper left”. It represents the location of the legend. Other options can be: “best”, “upper right”, “upper left”, “lower left”, “lower right” , “right”, “center left”, “center right”, “lower center”, “upper center”, “center”.
- bbox_to_anchor: [takes a list or tuple of 2 int/float, optional parameter ]. It represents the co-ordinates of legend on the graph. Both x and y co-ordinates are mandatory to give.
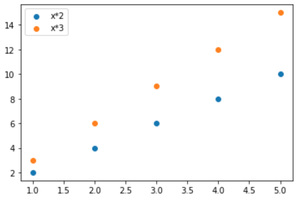
Example 1:
Python3
import matplotlib.pyplot as plt
x = [1,2,3,4,5]
y1 = [2,4,6,8,10]
y2 = [3,6,9,12,15]
plt.scatter(x, y1)
plt.scatter(x,y2)
plt.legend(["x*2" , "x*3"])
plt.show()
|
Output:
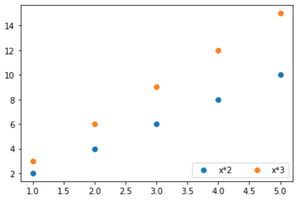
Example 2:
Python3
import matplotlib.pyplot as plt
x = [1,2,3,4,5]
y1 = [2,4,6,8,10]
y2 = [3,6,9,12,15]
plt.scatter(x, y1)
plt.scatter(x,y2)
plt.legend(["x*2" , "x*3"], ncol = 2 , loc = "lower right")
plt.show()
|
Output:
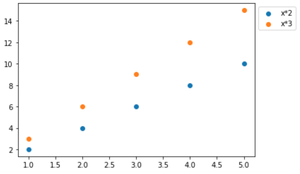
Example 3:
Python3
import matplotlib.pyplot as plt
x = [1,2,3,4,5]
y1 = [2,4,6,8,10]
y2 = [3,6,9,12,15]
plt.scatter(x, y1)
plt.scatter(x,y2)
plt.legend(["x*2" , "x*3"], bbox_to_anchor = (1 , 1))
plt.show()
|
Output:
Note : We may label the elements of the plot in matplotlib.pyplot.scatter() using “label” parameter. However, to show it matplotlib.pyplot.legend() must be written.
Example 4:
Python3
import matplotlib.pyplot as plt
import numpy as np
x = np.arange(1, 6)
y1 = x**2
y2 = x**4
plt.scatter(x, y1, label="x**2")
plt.scatter(x, y2, label="x**4")
plt.legend()
plt.show()
|
Output:
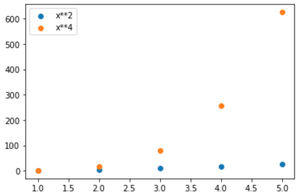
Note: If matplotlib.pyplot.legend() is not written in code, then labels will not be shown.
Share your thoughts in the comments
Please Login to comment...