Style Plots using Matplotlib
Last Updated :
17 Dec, 2020
Matplotlib is the most popular package or library in Python which is used for data visualization. By using this library we can generate plots and figures, and can easily create raster and vector files without using any other GUIs. With matplotlib, we can style the plots like, an HTML webpage is styled by using CSS styles. We just need to import style package of matplotlib library.
There are various built-in styles in style package, and we can also write customized style files and, then, to use those styles all you need to import them and apply on the graphs and plots. In this way, we need not write various lines of code for each plot individually again and again i.e. the code is reusable whenever required.
First, we will import the module:
from matplotlib import style
To list all the available styles:
Python3
from matplotlib import style
print(plt.style.available)
|
Output:
[‘Solarize_Light2’, ‘_classic_test_patch’, ‘bmh’, ‘classic’, ‘dark_background’, ‘fast’, ‘fivethirtyeight’, ‘ggplot’,’grayscale’,’seaborn’,’seaborn-bright’,’seaborn-colorblind’, ‘seaborn-dark’, ‘seaborn-dark-palette’, ‘seaborn-darkgrid’, ‘seaborn-deep’, ‘seaborn-muted’, ‘seaborn-notebook’, ‘seaborn-paper’, ‘seaborn-pastel’, ‘seaborn-poster’,’seaborn-talk’,’seaborn-ticks’,’seaborn-white’,’seaborn-whitegrid’,’tableau-colorblind10′]
Above is the list of styles available in package.
Syntax: plt.style.use(‘style_name”)
Where style_name is the name of the style which we want to use.
Approach:
- Import module.
- Create data for plot.
- Use the style want to add in plot.
- Create a plot.
- Show the plot.
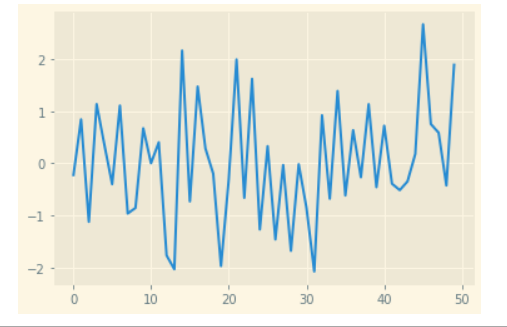
Example 1:
Python3
import numpy as np
import matplotlib.pyplot as plt
from matplotlib import style
data = np.random.randn(50)
plt.style.use('Solarize_Light2')
plt.plot(data)
plt.show()
|
Output:
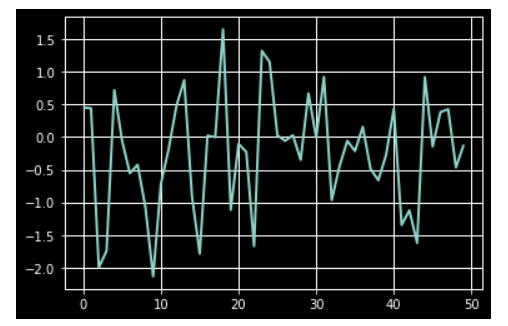
Example 2:
Python3
import numpy as np
import matplotlib.pyplot as plt
from matplotlib import style
data = np.random.randn(50)
plt.style.use('dark_background')
plt.plot(data)
plt.show()
|
Output:
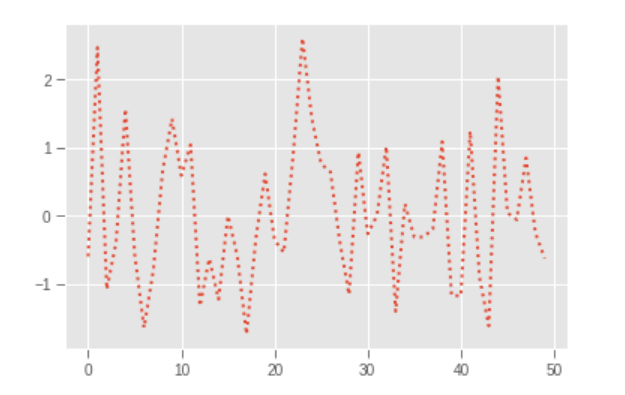
Example 3:
Python3
import numpy as np
import matplotlib.pyplot as plt
from matplotlib import style
data = np.random.randn(50)
plt.style.use('ggplot')
plt.plot(data, linestyle=":", linewidth=2)
plt.show()
|
Output:
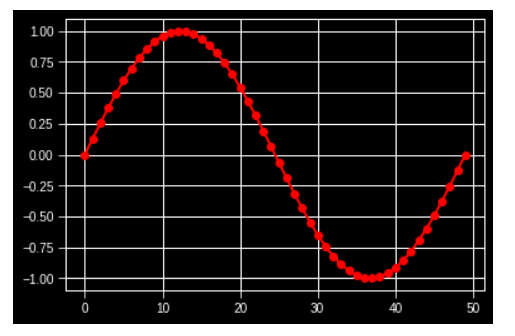
Note: If you only want to use a style for a particular plot but don’t want to change the global styling for all the plots, the style package provides a context manager for limiting the area of styling for a particular plot. To style changes for a plot, we can write something like this.
Example 4:
Python3
import numpy as np
import matplotlib.pyplot as plt
from matplotlib import style
with plt.style.context('dark_background'):
plt.plot(np.sin(np.linspace(0, 2 * np.pi)), 'r-o')
plt.show()
|
Output:
Share your thoughts in the comments
Please Login to comment...