How Change the vertical spacing between legend entries in Matplotlib?
Last Updated :
13 Jan, 2021
Prerequisites: Matplotlib
In this article, we will see how can we can change vertical space between labels of a legend in our graph using matplotlib, Here we will take two different examples to showcase our graph.
Approach:
- Import required module.
- Create data.
- Change the vertical spacing between labels.
- Normally plot the data.
- Display plot.
Implementation:
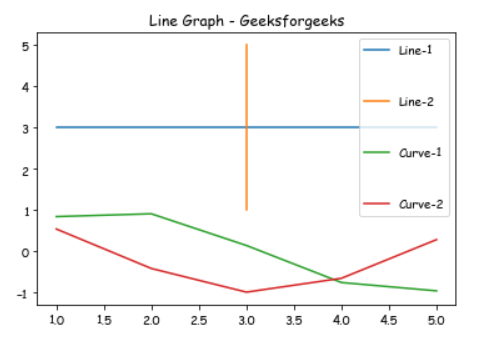
Example 1:
In this example, we will draw different lines with the help of matplotlib and Use the labelspacing argument to plt.legend() to change the vertical space between labels.
Python3
import matplotlib.pyplot as plt
import numpy as np
X = [1, 2, 3, 4, 5]
Y = [3, 3, 3, 3, 3]
plt.plot(X, Y, label = "Line-1")
plt.plot(Y, X, label = "Line-2")
plt.plot(X, np.sin(X), label = "Curve-1")
plt.plot(X, np.cos(X), label = "Curve-2")
plt.legend(labelspacing = 3)
plt.title("Line Graph - Geeksforgeeks")
plt.show()
|
Output:
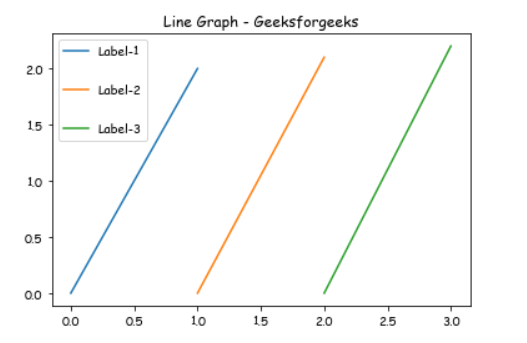
Example 2:
In this example, we will draw a Vertical line with the help of matplotlib and Use the labelspacing argument to plt.legend() to change the vertical space between labels.
Python3
import matplotlib.pyplot as plt
plt.plot([0, 1], [0, 2.0], label = 'Label-1')
plt.plot([1, 2], [0, 2.1], label = 'Label-2')
plt.plot([2, 3], [0, 2.2], label = 'Label-3')
plt.legend(labelspacing = 2)
plt.title("Line Graph - Geeksforgeeks")
plt.show()
|
Output:
Like Article
Suggest improvement
Share your thoughts in the comments
Please Login to comment...