Plotting different types of plots using Factor plot in seaborn
Last Updated :
21 Mar, 2024
Prerequisites: Introduction to Seaborn
Seaborn is an amazing visualization library for statistical graphics plotting in Python. It provides beautiful default styles and color palettes to make statistical plots more attractive. It is built on the top of matplotlib library and also closely integrated to the data structures from pandas.
Factor Plot
Factor Plot is used to draw a different types of categorical plot. The default plot that is shown is a point plot, but we can plot other seaborn categorical plots by using of kind parameter, like box plots, violin plots, bar plots, or strip plots.
Dataset Snippet :
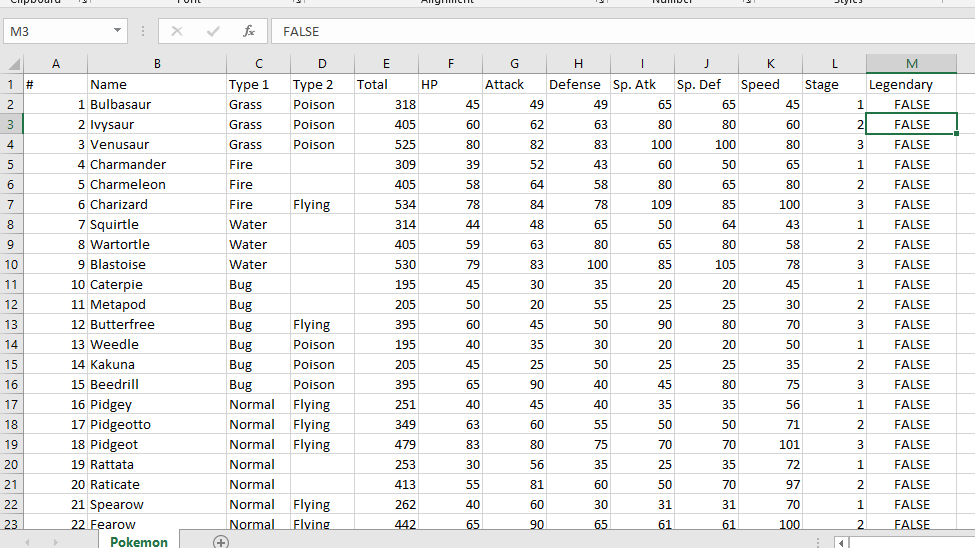
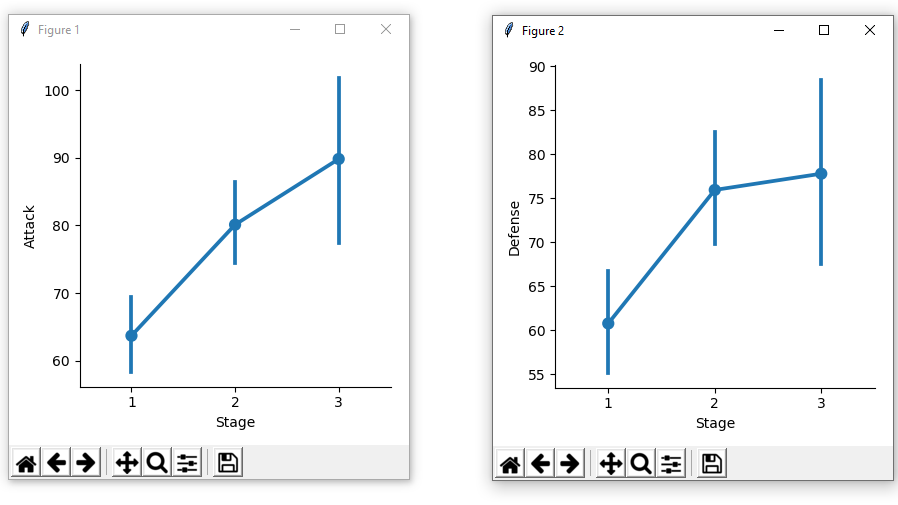
Code 1: Point plot using factorplot() method of seaborn.
import pandas as pd
import seaborn as sns
import matplotlib.pyplot as plt
df = pd.read_csv('Pokemon.csv')
sns.factorplot(x ='Stage', y ='Attack', data = df)
sns.factorplot(x ='Stage', y ='Defense', data = df)
plt.show()
|
Output:
Code 2: Violin plot using factorplot() method of seaborn.
import pandas as pd
import seaborn as sns
import matplotlib.pyplot as plt
df = pd.read_csv('Pokemon.csv')
sns.factorplot(x ='Type 1', y ='Attack',
kind = 'violin', data = df)
plt.show()
|
Output:

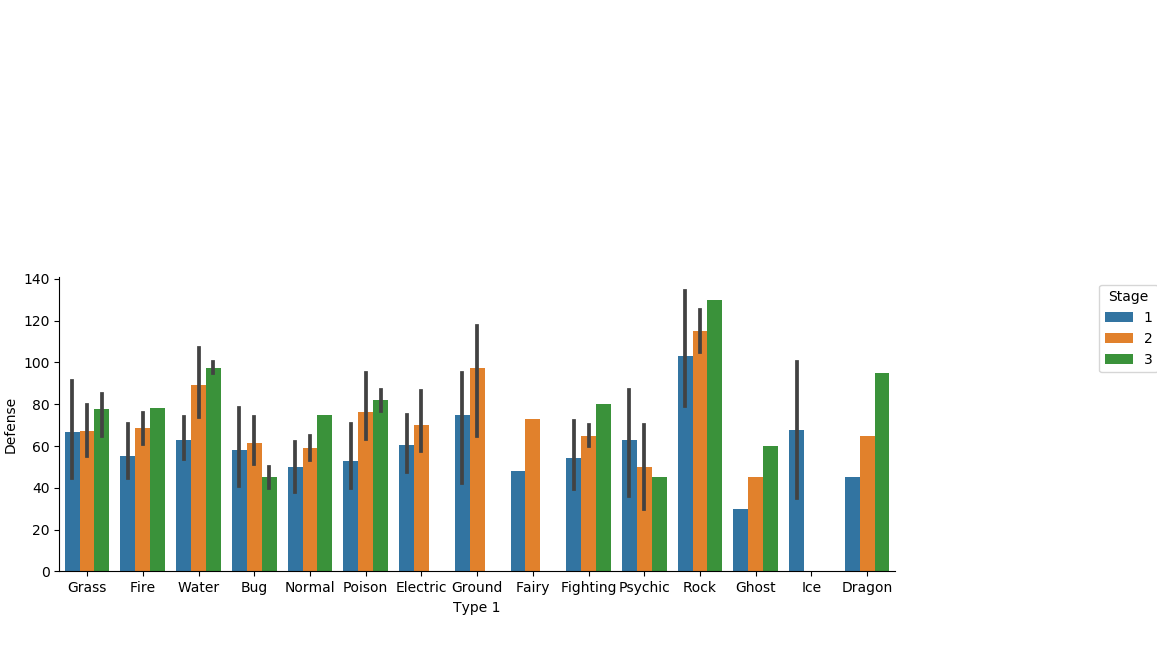
Code 3: Bar plot using factorplot() method of seaborn.
import pandas as pd
import seaborn as sns
import matplotlib.pyplot as plt
df = pd.read_csv('Pokemon.csv')
sns.factorplot(x ='Type 1', y ='Defense',
kind = 'bar', hue = 'Stage',
data = df)
plt.show()
|
Output:
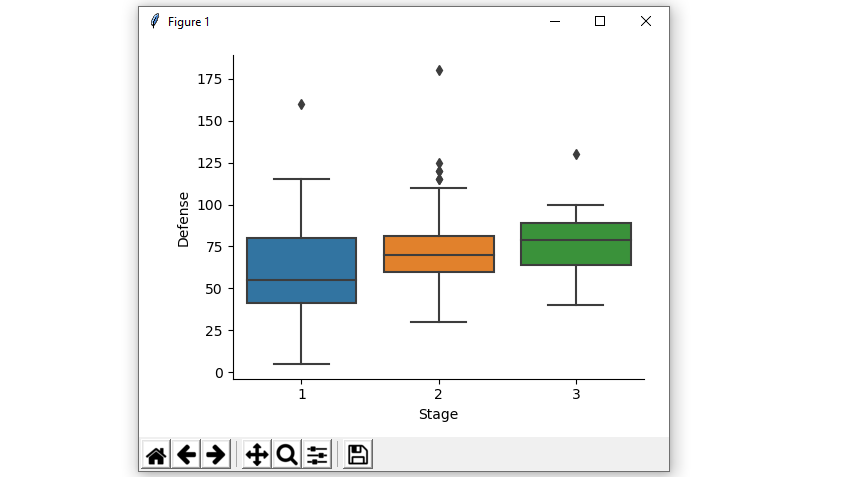
Code 4: Box plot using factorplot() method of seaborn.
import pandas as pd
import seaborn as sns
import matplotlib.pyplot as plt
df = pd.read_csv('Pokemon.csv')
sns.factorplot(x ='Stage', y ='Defense',
kind = 'box', data = df)
plt.show()
|
Output:
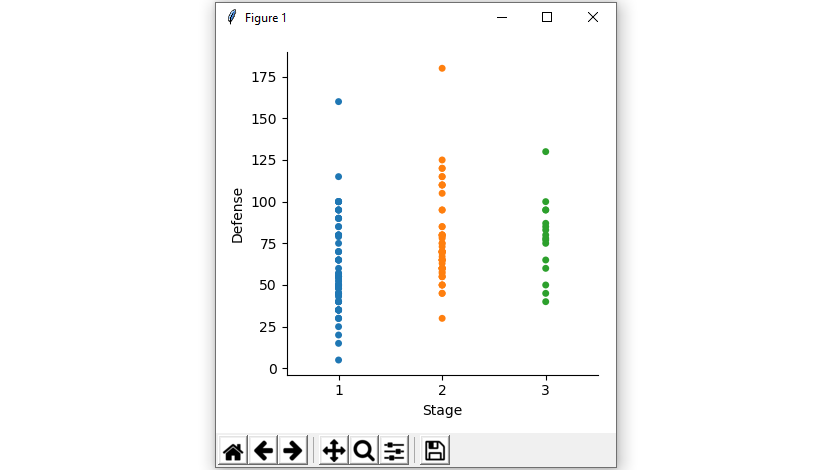
Code 5: Strip plot using factorplot() method of seaborn.
import pandas as pd
import seaborn as sns
import matplotlib.pyplot as plt
df = pd.read_csv('Pokemon.csv')
sns.factorplot(x ='Stage', y ='Defense',
kind = 'strip', data = df)
plt.show()
|
Output:
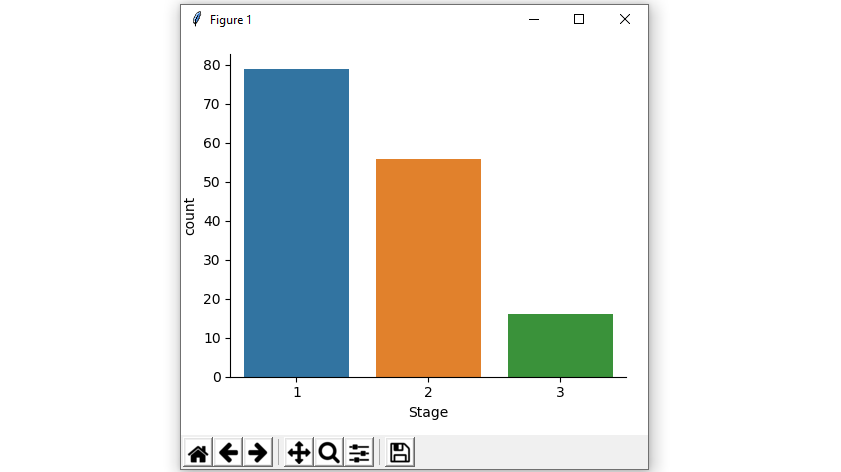
Code 6: Count plot using factorplot() method of seaborn.
import pandas as pd
import seaborn as sns
import matplotlib.pyplot as plt
df = pd.read_csv('Pokemon.csv')
sns.factorplot(x ='Stage', kind = 'count', data = df)
plt.show()
|
Output:
Share your thoughts in the comments
Please Login to comment...