How to Make Countplot or barplot with Seaborn Catplot?
Last Updated :
25 Nov, 2020
In Python, we can normally plot barcharts for numerical variables. But when it comes to the case of categorical variables then we cannot normally plot the count for each category. Here comes Seaborn Catplot in the picture. It allows you to plot the count of each category for non-numerical/categorical variables.
Creating the Countplot
Countplot gives a graphical visual for the count of observations in each category using bars. This cannot be used for quantitative variables. It can be created by passing the count value to the kind parameter.
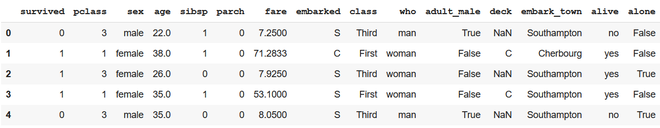
Example: Let’s take an example of a titanic dataset.
Python3
import matplotlib.pyplot as plt
import seaborn as sns
sns.set_style('darkgrid')
data = sns.load_dataset('titanic')
data.head()
|
Output:
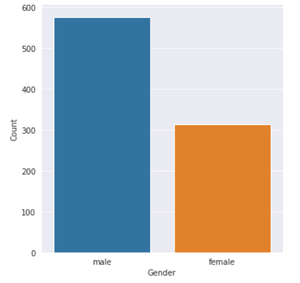
Example 1: Creating the countplot
Python3
sns.catplot(x='sex', kind='count', data=data)
plt.xlabel("Gender")
plt.ylabel("Count")
|
Output:
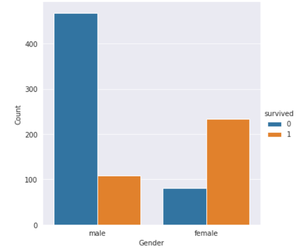
Example 2: Creating the grouped countplot
Python3
sns.catplot(x='sex', hue='survived',
kind='count', data=data)
plt.xlabel("Gender")
plt.ylabel("Count")
|
Output:
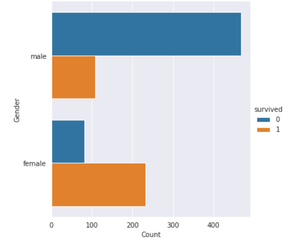
Example 3: Creating the horizontal countplot
Python3
sns.catplot(y='sex', hue='survived',
kind='count', data=data)
plt.xlabel("Count")
plt.ylabel("Gender")
|
Output:
Share your thoughts in the comments
Please Login to comment...