How to Change Fonts in matplotlib?
Last Updated :
13 Jan, 2021
Prerequisites: Matplotlib
In this article, we will see how can we can change the font family of our graph using matplotlib. A variety of fonts are in fact supported by matplotlib, alone has to do in order to implement is pass the name as value to fontname parameter.
Approach:
- Import required library.
- Create data
- Set changed font
- Normally plot the data
- Display plot
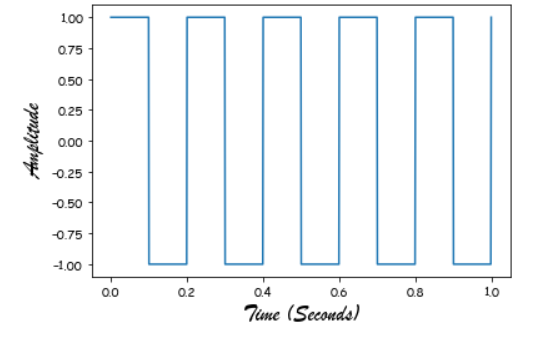
Example 1: Change the font just for the axis labels.
Python3
from scipy import signal
import matplotlib.pyplot as plot
import numpy as np
t = np.linspace(0, 1, 1000, endpoint=True)
plot.plot(t, signal.square(2 * np.pi * 5 * t))
plot.xlabel("Time (Seconds)", fontname="Brush Script MT", fontsize=18)
plot.ylabel("Amplitude", fontname="Brush Script MT", fontsize=18)
plot.show()
|
Output:
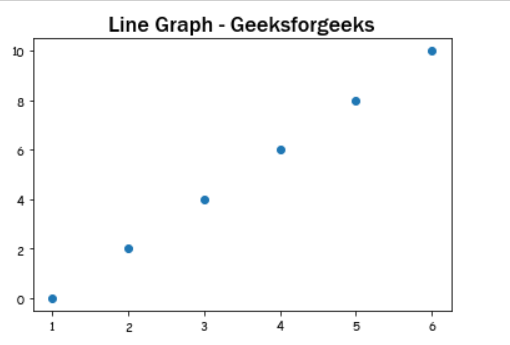
Example 2: Change the font just for the title.
Python3
import matplotlib.pyplot as plot
x = [1, 2, 3, 4, 5, 6]
y = [0, 2, 4, 6, 8, 10]
plot.scatter(x, y)
plot.title("Line Graph - Geeksforgeeks",
fontname='Franklin Gothic Medium', fontsize=18)
plot.show()
|
Output:
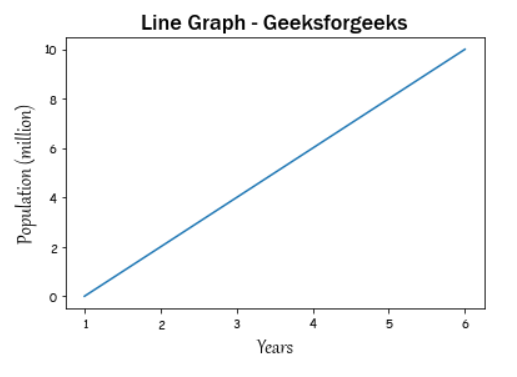
Example 3: Change the font just for the title and axis labels.
Python3
import matplotlib.pyplot as plot
x = [1, 2, 3, 4, 5, 6]
y = [0, 2, 4, 6, 8, 10]
plot.plot(x, y)
plot.xlabel("Years", fontname="Gabriola", fontsize=18)
plot.ylabel("Population (million)", fontname="Gabriola", fontsize=18)
plot.title("Line Graph - Geeksforgeeks",
fontname='Franklin Gothic Medium', fontsize=18)
plot.show()
|
Output:
Share your thoughts in the comments
Please Login to comment...