How to change the size of axis labels in Matplotlib?
Last Updated :
03 Jan, 2021
Matplotlib is a great data plotting tool. It’s used for visualizing data and also for presenting the data to your team on a presentation or for yourself for future reference. So, while presenting it might happen that the “X-label” and “y-label” are not that visible and for that reason, we might want to change its font size. So in this article, we are going to see how we can change the size of axis labels in Matplotlib.
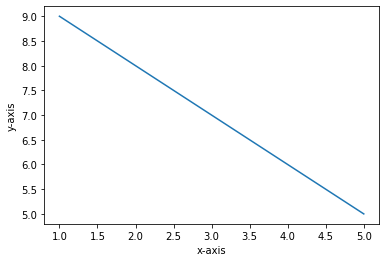
Before starting let’s draw a simple plot with matplotlib.
Python3
import matplotlib.pyplot as plt
x = [1, 2, 3, 4, 5]
y = [9, 8, 7, 6, 5]
fig, ax = plt.subplots()
ax.plot(x, y)
ax.set_xlabel('x-axis')
ax.set_ylabel('y-axis')
plt.show()
|
Output
Now we will see how to change the size of the axis labels:
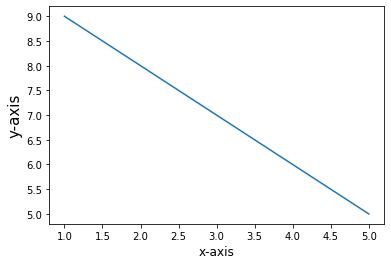
Example 1: Changing both axis label.
If we want to change the font size of the axis labels, we can use the parameter “fontsize” and set it your desired number.
Python3
import matplotlib.pyplot as plt
x = [1, 2, 3, 4, 5]
y = [9, 8, 7, 6, 5]
fig, ax = plt.subplots()
ax.plot(x, y)
ax.plot(x, y)
ax.set_xlabel('x-axis', fontsize = 12)
ax.set_ylabel('y-axis', fontsize = 10)
plt.show()
|
Output
Example 2: Changing the y-axis label.
Python3
import matplotlib.pyplot as plt
x = [1, 2, 3, 4, 5]
y = [9, 8, 7, 6, 5]
fig, ax = plt.subplots()
ax.plot(x, y)
ax.plot(x, y)
plt.xticks(fontsize = 15)
plt.show()
|
Output
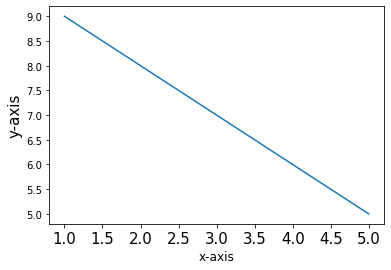
Here the font size of X values is being set to 15
Like Article
Suggest improvement
Share your thoughts in the comments
Please Login to comment...