How to Turn Off the Axes for Subplots in Matplotlib?
Last Updated :
29 Oct, 2021
In this article, we are going to discuss how to turn off the axes of subplots using matplotlib module. We can turn off the axes for subplots and plots using the below methods:
Method 1: Using matplotlib.axes.Axes.axis()
To turn off the axes for subplots, we will matplotlib.axes.Axes.axis() method here.
Python3
import matplotlib.pyplot as plt
import matplotlib.tri as mtri
import numpy as np
x = np.asarray([0, 1, 2, 3, 0.5,
1.5, 2.5, 1, 2,
1.5])
y = np.asarray([0, 0, 0, 0, 1.0,
1.0, 1.0, 2, 2,
3.0])
triangles = [[0, 1, 4], [1, 5, 4],
[2, 6, 5], [4, 5, 7],
[5, 6, 8], [5, 8, 7],
[7, 8, 9], [1, 2, 5],
[2, 3, 6]]
triang = mtri.Triangulation(x, y, triangles)
z = np.cos(1.5 * x) * np.cos(1.5 * y)
fig, axs = plt.subplots()
axs.tricontourf(triang, z)
axs.triplot(triang, 'go-', color ='white')
axs.set_axis_off()
axs.set_title('Triangle illustration')
plt.show()
|
Output:
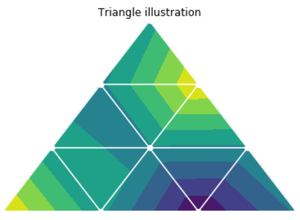
Here, we turn off axes using the axis(“off”) statement.
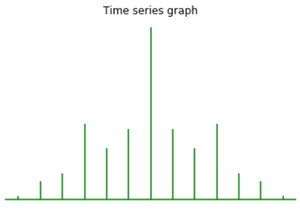
Method 2: Using matplotlib.axes.Axes.set_axis_off()
We use matplotlib.axes.Axes.set_axis_off() to turn the x-and y-pivot off influencing the axis lines, ticks, ticklabels, network and axis marks as well.
Python3
import matplotlib.pyplot as plt
import numpy as np
geeksx = np.array([24.40, 110.25, 20.05,
22.00, 61.90, 7.80,
15.00])
geeksy = np.array([24.40, 110.25, 20.05,
22.00, 61.90, 7.80,
15.00])
fig, ax = plt.subplots()
ax.xcorr(geeksx, geeksy, maxlags = 6,
color ="green")
ax.set_axis_off()
ax.set_title('Time series graph')
plt.show()
|
Output:
Method 3: Using matplotlib.pyplot.axis()
In a visualization, if the figure has a single plot in it, we can turn off the axes for subplots by making look like a contention to the matplotlib.pyplot.axis() technique. If the figure contains different subplots, this technique just turns off axes for the last subplot.
Python3
import matplotlib.pyplot as plt
x = [-5, -4, -3, -2, -1, 0, 1, 2, 3, 4, 5]
y = []
for i in range(len(x)):
y.append(max(0, x[i]))
ax = plt.plot(x, y, color='green')
plt.axis('off')
plt.title("ReLU function graph")
plt.show()
|
Output:
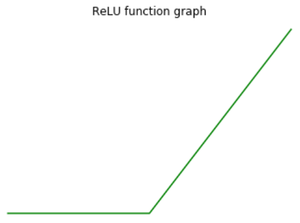
Here, we turn off axes using the plt.axis(“off”) statement.
Share your thoughts in the comments
Please Login to comment...