Count Unique values in Excel is a feature that can help you to find the values that occur only once in the huge list of Excel. We often need to report the Unique number of customers purchased, the number of products in our stock, List of regions our business covered.
In this article, we explain how to count unique values in an Excel column. Before moving ahead you should know the difference between unique values and distinct values.
Unique Values: These are the values that occur only once. Unique Values from the list {1,2,3,1,4,2,7,5,7} are {3,4,5}.
Distinct Values: These are the Values that are different. Distinct values from the list are {1,2,3,1,4,2,7,5,7} are {1,2,3,4,5,7}
How to Count Unique Values in Excel
Unique Values in Excel appear in a list of items that occur only once. The main aim of counting unique and distinct values is to separate them from the duplicates of the list in Excel.
Syntax
COUNTIF (range, criteria)
Range – List of data
Criteria – A number of texts. Apply on the input range
Return an integer value that matches the criteria
There are many ways to find the count of unique and duplicates in Excel some of them are as follows:
Sample Data
We have given sample data with two fields Customer and Products purchased. Need to create a summary report to show how many customers are in our database.
Count Unique Values in a Column Using SUM and COUNTIF Functions
Using SUM and COUNTIF formulas together. This is the easiest and simplest way to find Distinct values in Excel.
Note: We can also use SUMPRODUCT instead of SUM.
Syntax: COUNTIF(range, criteria)
Step 1: Type “Number of Customers” in the cell.
Step 2: Write the below formula in any cell, to count the number of unique customers. We use the Array formula to compute unique count, So make sure you have to Press “Ctrl+Shift+Enter” for curly braces as shown in Image 1 below:
Formula:
=SUM(1/COUNTIF(B2:B22,B2:B22))
Your formula in cell D7 should be covered with “{}“ Curly braces as shown in Image 2 below:
Note: The result of the COUNTIF formula is used as a divisor with 1 as the numerator. This modifies the result of the COUNTIF formula, the value that appears only once in the array becomes 1 and the numbers which have duplicate values will become fractions corresponding to the multiple.
How to Count Unique Text Values in Excel
In case your Excel list contains both text and numerical values and you want to count only unique text values then you can count unique text values in Excel by using ISTEXT Function to the formula.
Syntax
=SUM(IF(ISTEXT(A2:A10)*COUNTIF(A22:A10,A2:A10)=1,1,0))
ISTEXT functions return TRUE if the checked value is text value or else FALSE. Here in the formula (*) asterisk works as the AND operator in the formula, which means the IF function returns 1 only if a value is both text and unique, Otherwise 0. And the SUM function adds up all 1’s and you can get the count of text values as the output.
Note: Always remember to press Ctrl + Shift + Enter for an array formula.
As you can see the formula returns the value 2, because we have only two text +unique values.
How to Count Unique Numeric Values in Excel
In case your Excel list consists of both types of values numeric as well as text. But you want the Count of Numeric that is unique in the list. In that case, you can use the ISNUMBER function in the formula.
Syntax :
=SUM(IF(ISNUMBER(A2:A10)*COUNTIF(A2:A10,A2:A10)=1,1,0))
Count Case – Sensitive Unique Values in Excel
The simple way to count unique values when you have Case-Sensitive data would be creating a helper column with the following array formula to identify duplicates and unique items.
Formula:
=IF(SUM((–Exact($A$2:$A$10,A2)))=1,”Unique”,”Duplictae”)
and then use a COUNTIF function to count unique values:
=COUNTIF(B2:B10,”Unique”)
In the above image, you can see the Count of unique values is 5.
How to use the UNIQUE Function to Count Unique Values in Excel
If you are using MS Office 365, you can use the below formula to compute the unique count.
=COUNTA(UNIQUE(B2:B30)
Syntax
COUNTA(Value1, Value2,…..)
Value1 – A cell, excel range, an array of text
Return count of non-empty cells.
UNIQUE(array, by_col, exactly_once)
Array – list of data values to return unique
by_col -Boolean value [ True – return unique columns/ False -return unique rows]
Exactly_once – Boolean value [return only distinct values ]
How to use the COUNTA Function to Count Unique Values in Excel
COUNTIFS allows you to count values based on one or more criteria. COUNTIFS Function counts the distinct values from the range.
Formula used is: Sum( 1/COUNTIFS(B2:B22,B2:B22))
Note: Don’t Forget to press the “CTRL+SHIFT+ENTER” to put curly brackets to use an Array formula. Because the array formula doesn’t work in older versions of Excel.
How to Count Distinct Values Using the Advanced Filters in Excel
Advanced filters are a feature in Excel that allows you to specify complex criteria using formulas.
To use advanced filters in Excel, User needs to go to the ” DATA” tab, select the “Advanced Filter” option and define the range criteria range and the output range.
This can also help you to find Distinct values in Excel.
Subtotal is the function that can be used to count only the visible items in your list. As shown in the below image, Here 103 argument is used to tell the SUBTOTAL function to Count all the visible items in the particular range.
Steps to count the Distinct values using the Advanced Filter
Step 1: Select the column.
Select the column in which you want to count the distinct values from the table.
Step 2: Select the Advance filter.
Now go to the “Data” option in the ribbon and select “Advanced Filter” from it.
Step 3: Tick the Unique records only.
Step 4: Press “ok”
Step 5: Now you can see the count of distinct records only.
.png)
How to Count Distinct Value Using Pivot Table
Follow the steps to Count Distinct values using the Pivot table:
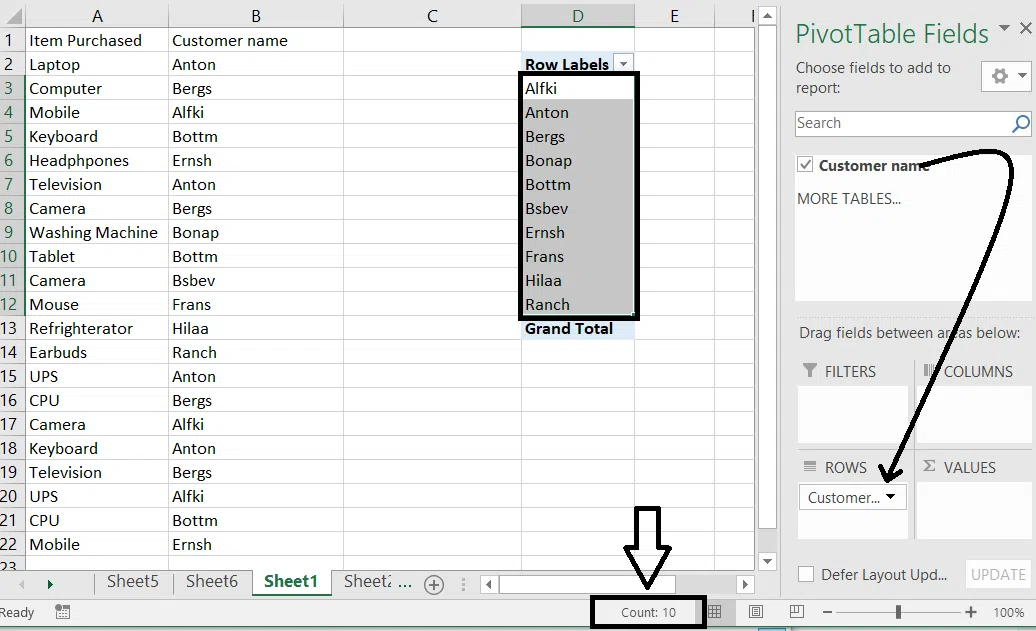
Step 1: Create a Pivot Table of the Data
You first need to create a pivot table of Data in which you need to count the Distinct values.
Step 2: Add your item like Customer name into Rows by dragging
Step 3: Now as you can see the Row labels with the Distinct values in the column, Select the range of data of which you want the Count of Distinct values.
Step 4: Preview Count of Distinct Values
How to Count Distinct Values Using VBA
There is no in-built Function in Excel to Count the distinct values from the range. But with the help of VBA, we can make our function count the distinct Values in Excel.
Follow the steps to Count distinct values using VBA:
Step 1: Open the VBA
Select the Developer Tab in the ribbon then select Visual Basic, Now click on Insert and go to the module.
Step 2: Now write the Below code on the VBA screen
.png)
Step 3: This function will help you to create a new function in Excel COUNT DISTINCT VALUES which can be used just like other functions in Excel.
You can use the above VBA code to create a new function to count distinct values in Excel.
Also Read
FAQs
Is there a formula to count unique values in Excel?
Yes, you can use a formula to count unique values in Excel. One common way to do this is by using the combination of the COUNTIF and SUM functions along with an array formula. Here’s how you can do it:
What are Unique Values in Excel?
Unique Values in Excel appear in a list of items that occur only once. The main aim of counting unique an distinct values is to separate them from the duplicates of the list in Excel.
How we can Count distinct values in multiple columns simultaneously in Excel?
We can count distinct values in multiple columns with the help of the SUM and COUNTIFS functions together.
Step 1: Select any random cell where you want the result to display.
Step 2: Use the Formula “=SUM(1/COUNTIFS(range1,range1, range 2,range2…)” where ranges are the cells in which you want to count the distinct values.
Step 3: Press “CTRL+SHIFT+ENTER” because of an array formula.
What are the distinct values in Excel?
Distinct values in Excel are the unique values that appear only once in a range of cells. For example, distinct values from the Range {A, B, B, C, C, D} are {A, B, C, D}.
Explain the formula “=SUM(1/COUNTIFS(B5:B14,B5:B14)”.
The COUNTIFS function is used to see how many times a value appears in the list. This will give you a fractional value that will add up to 1 for each distinct value in the list after inverting this.
And SUM function then adds all the fractions up and the total is the number of distinct values in the list.
Is there any In-built function to count the distinct values in Excel without using any formula?
There is no Inbuilt function in Excel to count Distinct values without using formulas. The alternative way is to use the “ Remove Duplicates” feature, This will help you to remove duplicates and give you the Count of unique values.
Like Article
Suggest improvement
Share your thoughts in the comments
Please Login to comment...