How to Find the Intersection of Two Curves in Excel?
Last Updated :
24 Jul, 2022
The intersection of the two curves is the point where the two curves meet, and their coordinates are the same. In this article, we will learn about how to find the intersection point of the two curves in excel. Finding the intersection point of two curves can be very useful in data analysis. Let’s learn the steps for the same,
Intersection Point of two curves in Excel
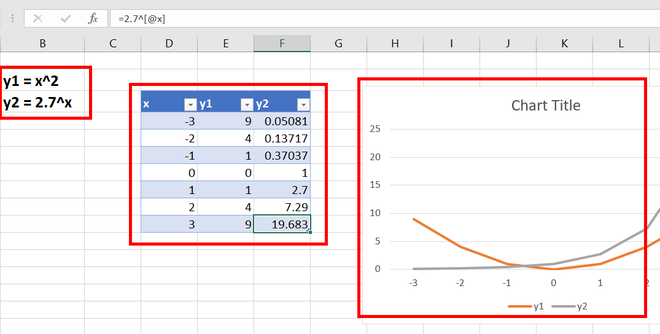
Consider two sales curves of different regions Vs the year, and if they intersect at some point, then we would have insight at what time interval the sales of two different regions are matching or how close or how apart they are. For example, “Arushi” is a data analyst, and she notices that sales pattern 1 follows the curvey = x2 and sales pattern 2 follows the curvey = 2.7x. Her task is to find the intersection point of the two sales curves. Given a data set with x, y1, and y2 values, the formula used to calculate y1 values is by sales pattern 1, and the formula used to calculate y2 values is by sales pattern 2. A chart is also created.
Following are the steps,
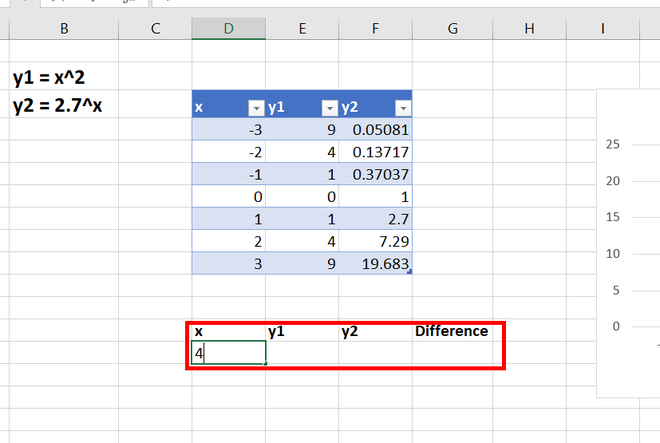
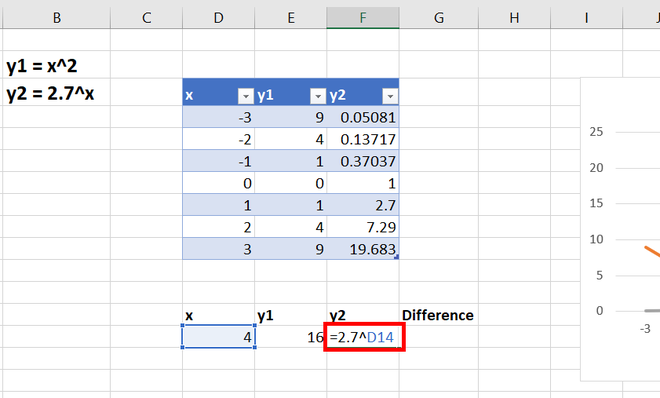
Step 1: Create a new table range with headings x, y1, y2, and differences. Write any random value of x in cell D14. For example, 4.
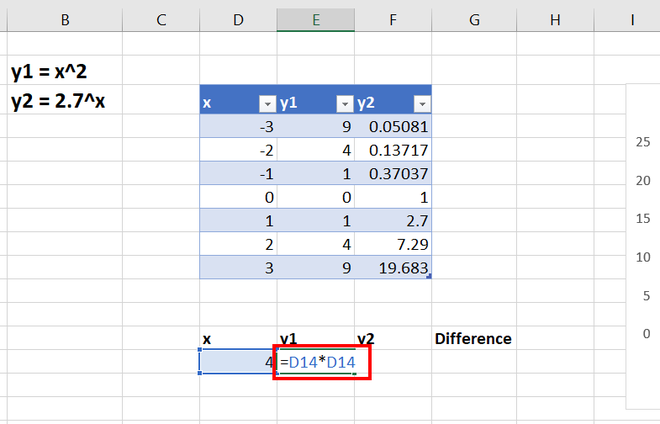
Step 2: Write the same formula used in y1, as above, i.e.,y = x2. For example, =D14*D14. Press Enter.
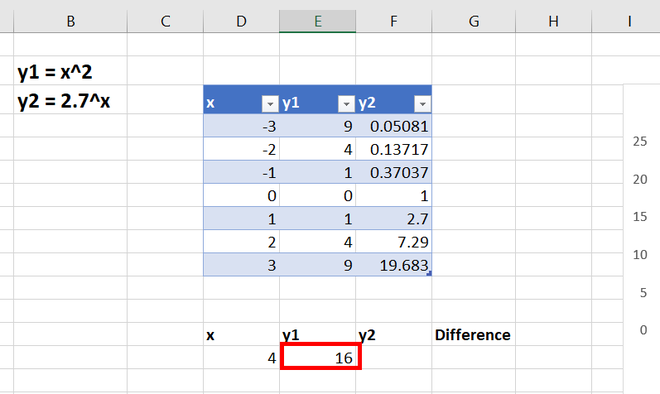
Step 3: The value appears in cell E14. For example, 16.
Step 4: Write the same formula used in y2, as above, i.e.,Y = 2.7x. For example, =2.7^D14. Press Enter.
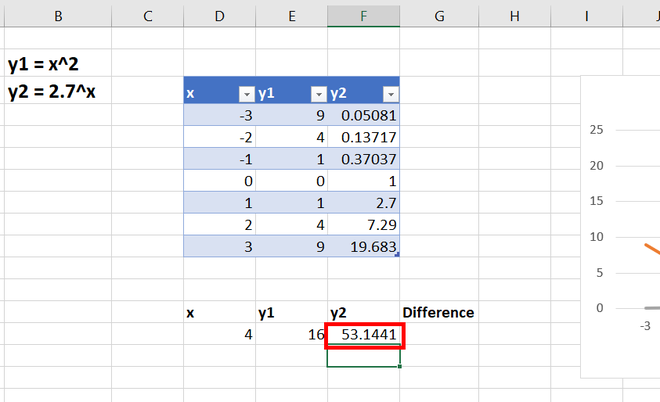
Step 5: The value appears in cell F14. For example, 53.1441.
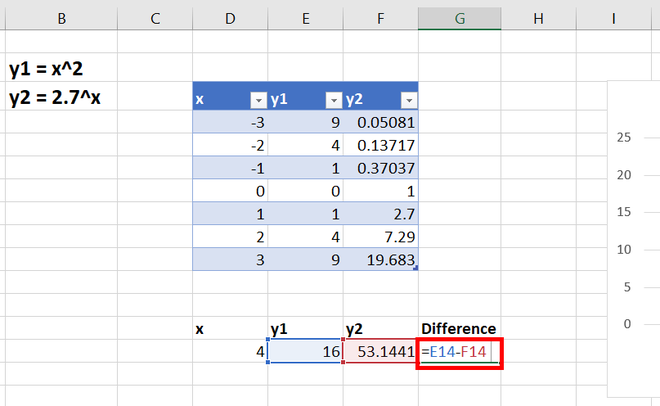
Step 6: In the difference column, we are storing the difference between y1 and y2. This is done because we know that, at the intersection, the value y of both curves will be equal. This will be helpful in the later stages. Write =E14 – F14 is the cell G14. Press Enter.
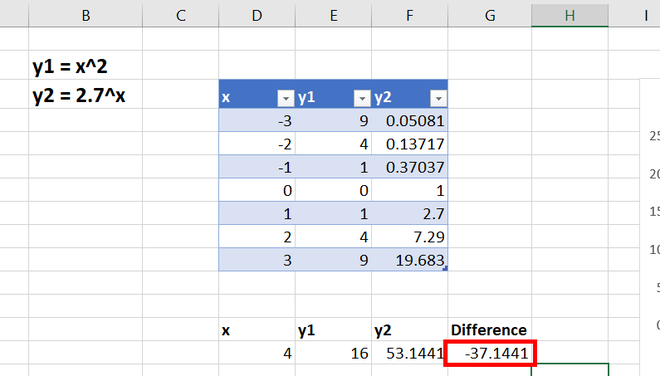
Step 7: The value appears in cell G14. For example, -37.1441.
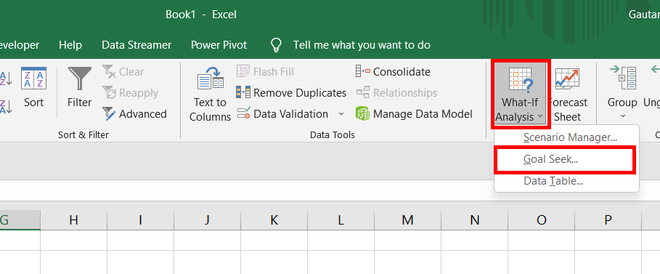
Step 8: Your active cell should be G14. Go to the Data tab, under the Forecast section, and click on the What-if Analysis. Click on the ribbon, and a drop-down appears. Select Goal Seek.
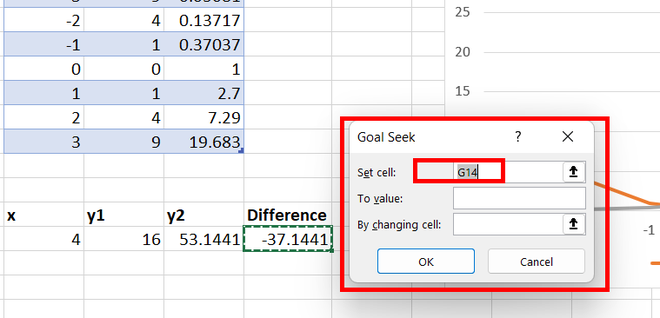
Step 9: Goal Seek dialogue box appears. In the set cell, select the cell G14, i.e., the difference column cell.
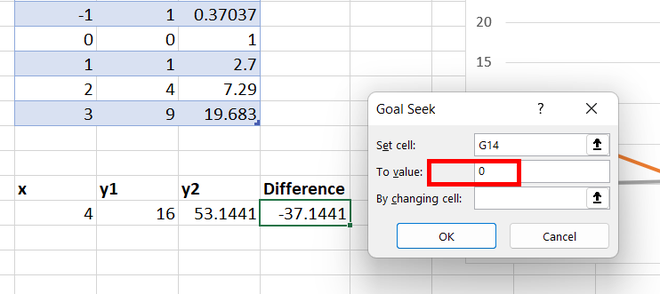
Step 10: We know that at the point of intersection, the difference between the y coordinates of the 2 curves is the same. So, it states that we need to put our difference value to zero(0).
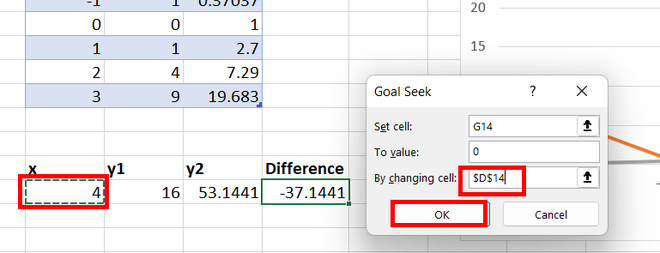
Step 11: As all the formulas are dependent on the x value, we need to calculate the difference of 0 by changing the x value. So, select D14 in by changing Cell. Click Ok.
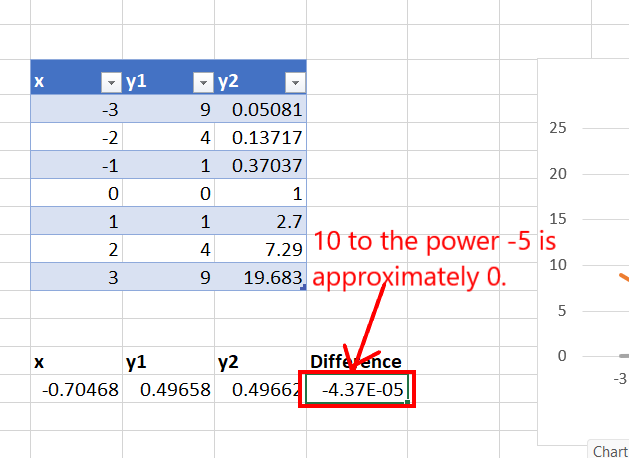
Step 12: The intersection point appears. The value of x is -0.70468, y1 is 0.49658, and y2 is 0.49662. The difference is 10-5, which tends to be 0.
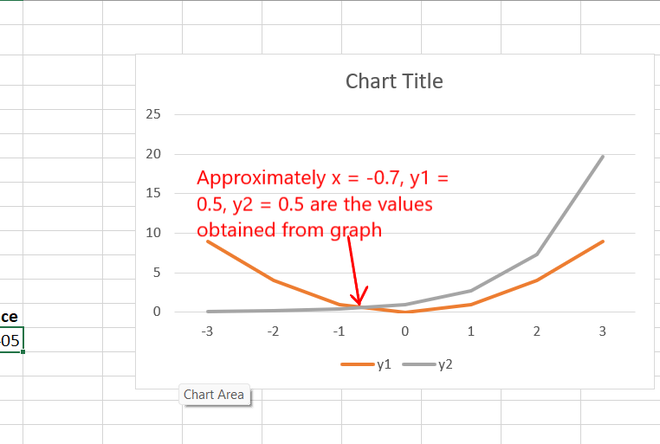
Step 13: By graph also, we can observe that our values are correct.
Like Article
Suggest improvement
Share your thoughts in the comments
Please Login to comment...