The term normalization in itself is a buzzword that is popular amongst people who come from different fields such as Machine Learning, Data Science, Statistics, etc. Normalization is a general term that means to scale down values inside a certain range. The origin of the word normalization being a buzzword comes from the fact that it is often misunderstood by people and is interchangeably used with another statistical term standardization. In this article, we are going to demystify both of these terms and later we will read how we can implement these techniques on a sample dataset in Excel.
Normalization (Or Min-Max scaling) data in excel
It is the process of scaling data in such a way that all data points lie in a range of 0 to 1. Thus, this technique, makes it possible to bring all data points to a common scale. The mathematical formula for normalization is given as:
 , where X is the data point, Xmax and Xmin are the maximum and minimum value in the group of records respectively. The process of normalization is generally used when the distribution of data does not follow the Gaussian distribution.
Let’s have a look at one example to see how can we perform normalization on a sample dataset. Suppose, we have a record of the height of 10 students inside a class as shown below:
| Height (in cm) |
| 152 |
| 155 |
| 168 |
| 175 |
| 153 |
| 162 |
| 173 |
| 166 |
| 158 |
| 156 |
Step 1: Calculate the minimum value in the distribution. It can be calculated using the MIN() function. The minimum value comes out to be 152 which is stored in the B14 cell.
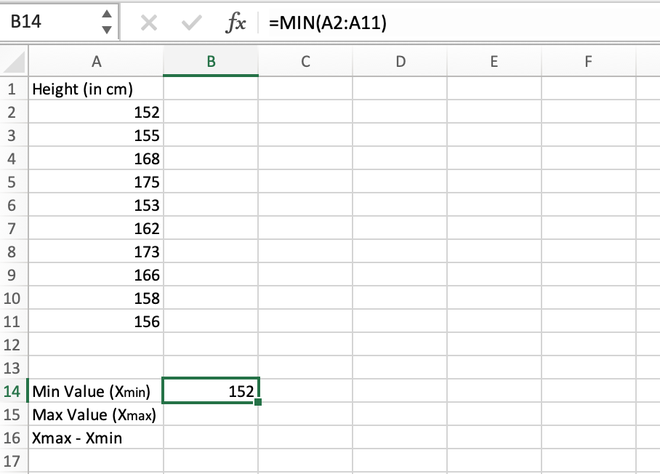
Calculating the minimum value using the MIN() function
Step 2: Calculate the maximum value in the distribution. It can be calculated using the MAX() function. The maximum value comes out to be 175 which is stored in the B15 cell.
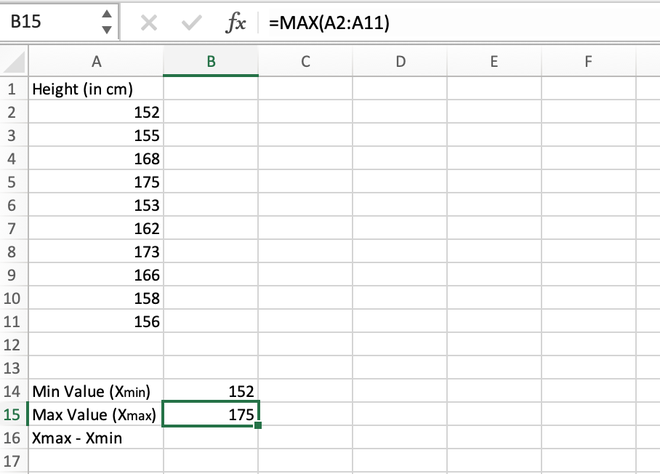
Calculating the maximum value using the MAX() function
Step 3: Find the difference between the maximum and minimum values. Their difference comes out to be 175 – 152 = 23 which is stored in the B16 cell.
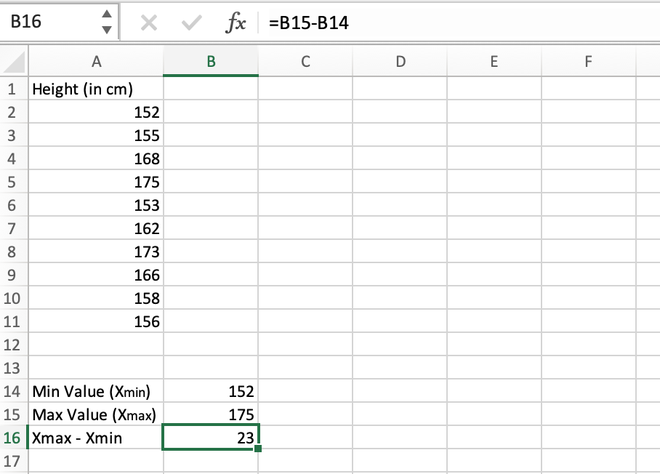
Calculating the difference (Max-Min)
Step 4: For the first data stored in the A2 cell, we will calculate the normalized value as shown in the below video.
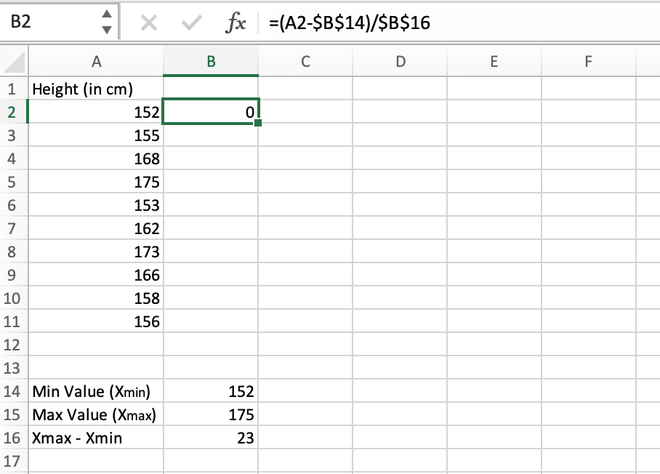
Calculating the normalized value for the first element
Step 5: We can manually calculate all values one by one for each data record or we can directly get values for all the other cells using the auto-fill feature of Excel. For this, go to the right corner of the B2 cell until a (+) symbol appears, and then drag the cursor to the bottom to auto-populate values inside all the cells.
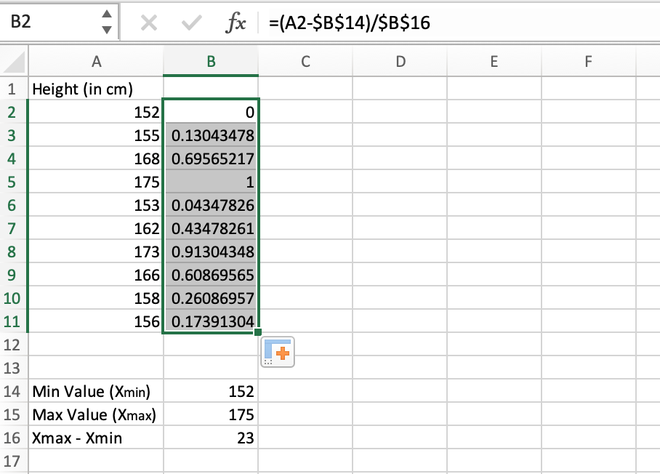
Calculating the normalized value for the entire range
Note: While calculating the first normalized value in the B2 cell, it should be made sure that the reference address for the B14 and B16 cells should be locked using Fn + F4 button otherwise an error will be thrown.
If we have a close look at the results, we can notice all the values lies in the range 0 to 1.
Standardization (Or Z-score normalization)
Standardization is a process in which we want to scale our data in such a way that the distribution of our data has its mean as 0 and standard deviation as 1. The mathematical formula for standardization is given as:
 , where where X is the data point, Xmean is the mean of the distribution and σx is the standard deviation of the distribution.
The process of standardization is generally used when we know the distribution of data follows the gaussian distribution.
Method 1: Calculating z-score normalization manually
Step 1: Calculate the mean/average of the distribution. It can be done using the AVERAGE() function. The mean value comes out to be 161.8 and is stored in the B14 cell.
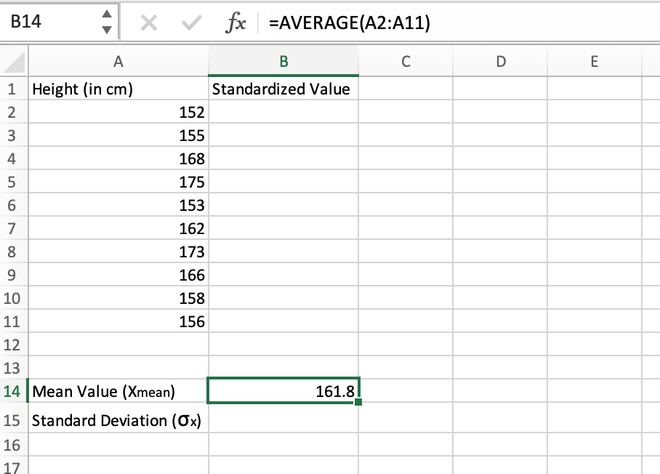
Calculating the mean value using the AVERAGE() function
Step 2: Calculate the standard deviation of the distribution which can be done using the STDEV() function. The standard deviation comes out to be 8.323994767 which is stored in the B15 cell.
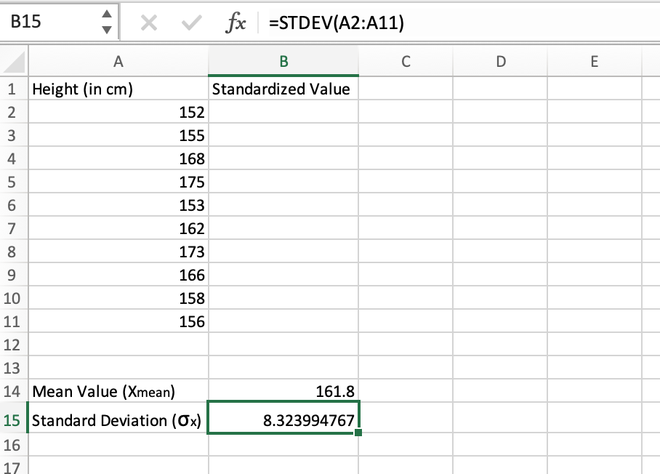
Calculating the standard deviation using the STDEV() function
Step 3: For the first data stored in the A2 cell, we will calculate the standardized value as shown in the image given below.
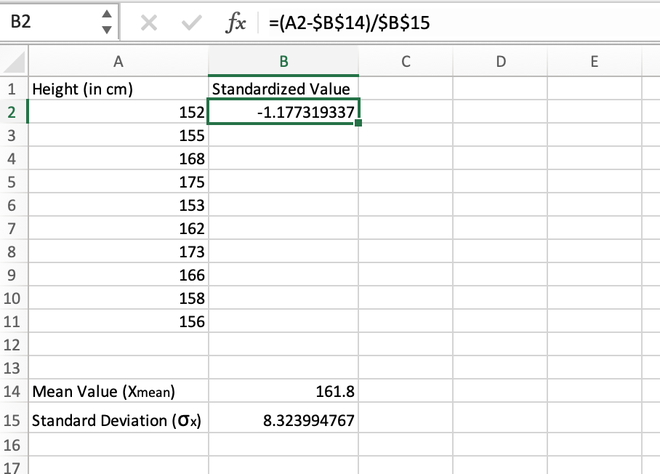
Calculating the standardized value for the first element
Step 4: After manually calculating the first value, we can simply use the auto-fill feature of Excel to populate the standardized values for all other records.
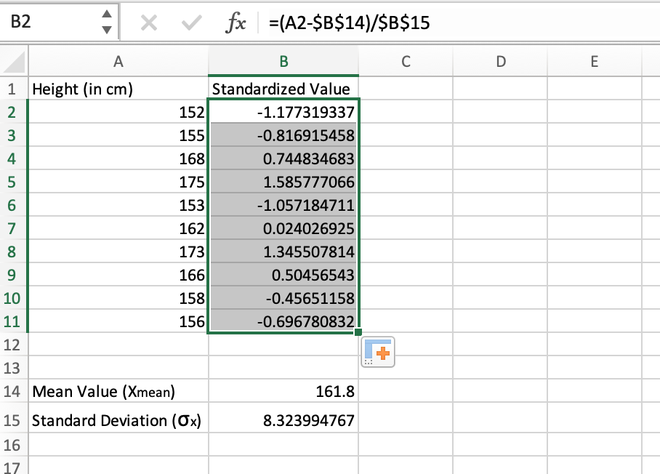
Calculating the standardized value for the entire range using auto-fill
Note: While calculating the first standardized value in the B2 cell, it should be made sure that the reference address for the B14 and B15 cells should be locked using Fn+F4 button otherwise an error will be thrown.
Method 2: Calculating Z-score normalization using the STANDARDIZE() function
We can even use the built-in STANDARDIZE() function to find the standardized value of an element. The syntax for STANDARDIZE() function is given as:
=STANDARDIZE(x,mean,std_dev)
Where x is the specific element/range of cells, mean is the average/arithmetic mean of all the elements in the record, and std_dev is the standard deviation of all the elements in the record
Step 1: Calculate the mean/average of the distribution. It can be done using the AVERAGE() function. The mean value comes out to be 161.8 and is stored in the B14 cell.
Calculating the mean value using the AVERAGE() function
Step 2: Calculate the standard deviation of the distribution which can be done using the STDEV() function. The standard deviation comes out to be 8.323994767 which is stored in the B15 cell.
Calculating the standard deviation using the STDEV() function
Step 3: For the first data stored in the A2 cell, we will calculate the standardized value as shown in the below image.
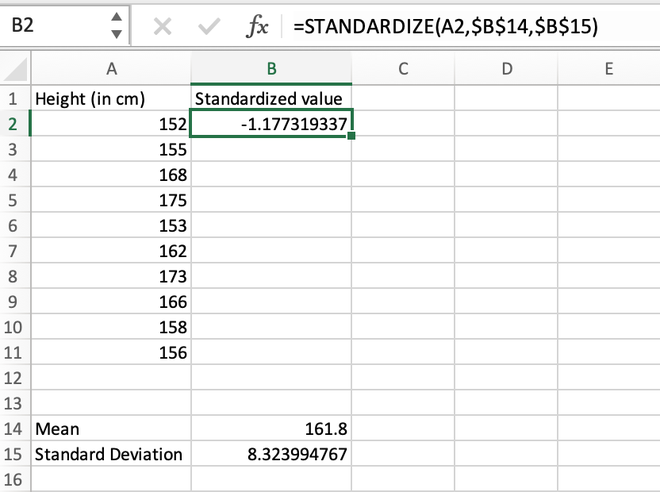
Calculating the standardized value for the first element using the STANDARDIZE() function
Step 4: After manually calculating the first value, we can simply use the auto-fill feature of Excel to populate the standardized values for all other records.
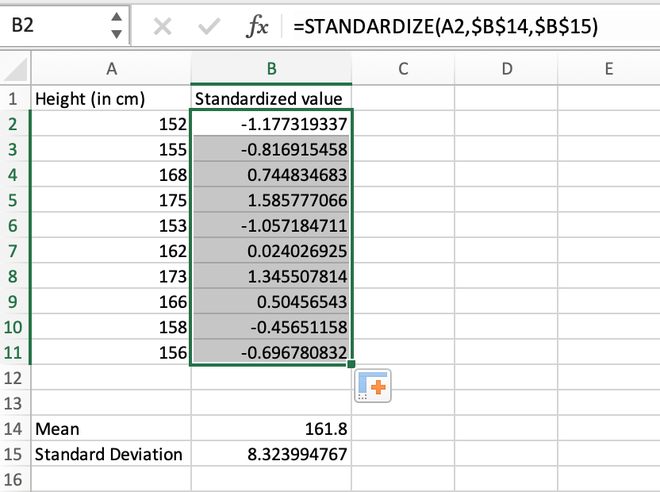
Calculating the standardized value for the entire range using auto-fill
Like Article
Suggest improvement
Share your thoughts in the comments
Please Login to comment...