How to Remove the Legend in Matplotlib?
Last Updated :
01 Feb, 2021
Matplotlib is one of the most popular data visualization libraries present in Python. Using this matplotlib library, if we want to visualize more than a single variable, we might want to explain what each variable represents. For this purpose, there is a function called legend() present in matplotlib library. This legend is a small area on the graph describing what each variable represents.
In order to remove the legend, there are four ways. They are :
- Using .remove()
- Using .set_visible()
- Fix legend_ attribute of the required Axes object = None
- Using label=_nolegend_
Method 1: Using .remove()
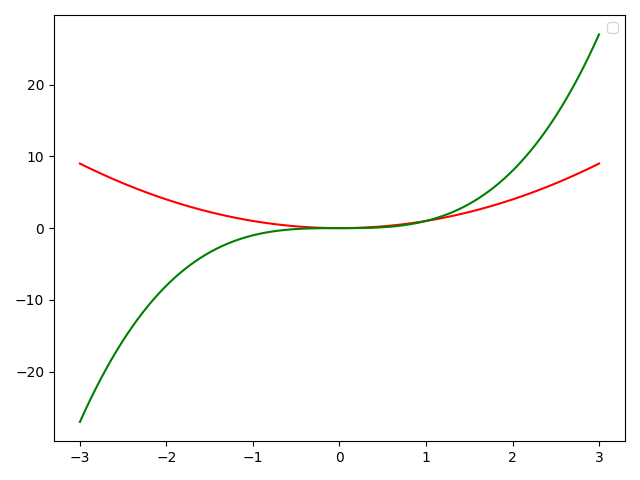
Example 1: By using ax.get_legend().remove() method, legend can be removed from figure in matplotlib.
Python3
import numpy as np
import matplotlib.pyplot as plt
x = np.linspace(-3, 3, 100)
y1 = np.power(x, 2)
y2 = np.power(x, 3)
fig, ax = plt.subplots()
ax.plot(x, y1, c = 'r',label = 'x^2')
ax.plot(x, y2, c = 'g',label = 'x^3')
leg = plt.legend()
ax.get_legend().remove()
plt.show()
|
Output :

We can see that there is no legend in the above figure.
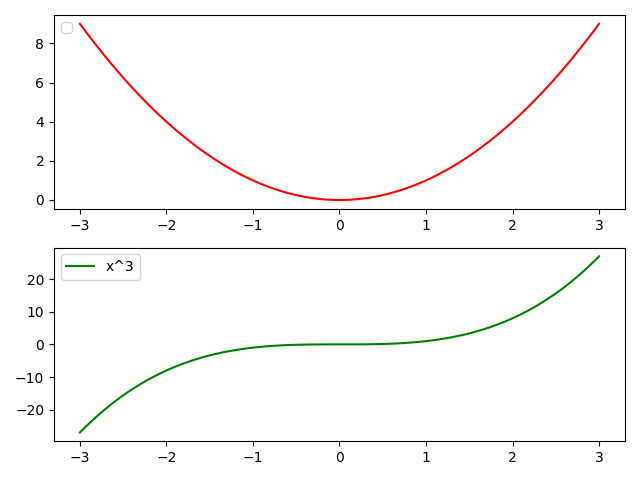
Example 2: More than one subplots :
In the case of more than one subplot, we can mention the required subplot object for which we want to remove the legend. Here, we have written axs[1].get_legend().remove() which means we are removing legend for second subplot specifically.
Python3
import numpy as np
import matplotlib.pyplot as plt
x = np.linspace(-3, 3, 100)
y1 = np.power(x, 2)
y2 = np.power(x, 3)
fig, axs = plt.subplots(2, 1)
axs[0].plot(x, y1, c = 'r',label = 'x^2')
axs[1].plot(x, y2, c = 'g',label = 'x^3')
axs[0].legend(loc = 'upper left')
axs[1].legend(loc = 'upper left')
axs[1].get_legend().remove()
plt.show()
|
Output :
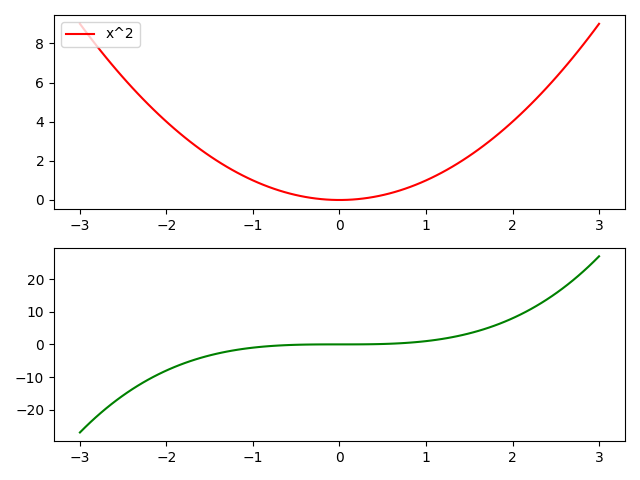
In the above figure, we removed the legend for the second subplot specifically. The first subplot will still have a legend.
Method 2: Using set_visible()
Example 1: By using ax.get_legend().set_visible(False) method, legend can be removed from figure in matplotlib.
Python3
import numpy as np
import matplotlib.pyplot as plt
x = np.linspace(-3, 3, 1000)
y1 = np.sin(x)
y2 = np.cos(x)
fig, ax = plt.subplots()
ax.plot(x, y1,c = 'r',label = 'Sine')
ax.plot(x, y2,c = 'g',label = 'Cosine')
leg = plt.legend()
ax.get_legend().set_visible(False)
plt.show()
|
Output :
We can see that there is no legend in the above figure.
Example-2. More than one subplots :
In case of more than one subplot, we can mention the required subplot object for which we want to remove the legend. Here, we have written axs[1].get_legend().set_visible(False) which means we are removing legend for second subplot specifically.
Python3
import numpy as np
import matplotlib.pyplot as plt
x = np.linspace(-3,3,1000)
y1 = np.sin(x)
y2 = np.cos(x)
fig, axs = plt.subplots(2,1)
axs[0].plot(x,y1,c='r',label = 'Sine')
axs[1].plot(x,y2,c='g',label = 'Cosine')
axs[0].legend(loc='upper left')
axs[1].legend(loc='upper left')
axs[1].get_legend().set_visible(False)
plt.show()
|
Output :
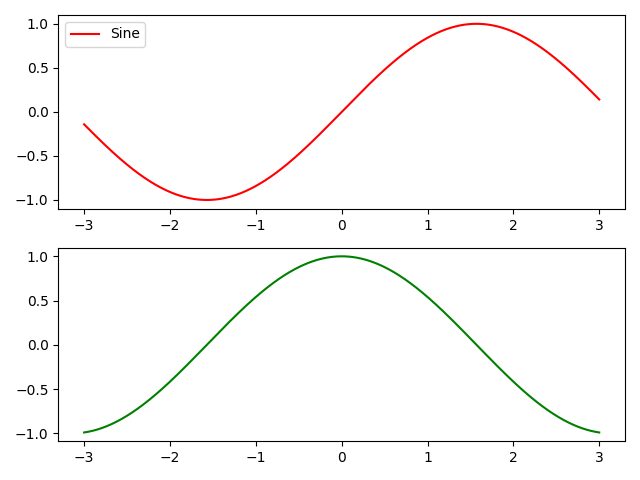
In the above figure, we removed legend for the second subplot specifically. The first subplot will still have legend.
Method 3: Fix legend_ attribute of the required Axes object = None :
Example 1: By using ax.legend_ = None, legend can be removed from figure in matplotlib.
Python3
import numpy as np
import matplotlib.pyplot as plt
x = np.linspace(-3, 3, 1000)
y1 = np.sin(x)
y2 = np.cos(x)
fig, ax = plt.subplots()
ax.plot(x, y1,c = 'r',label = 'Sine')
ax.plot(x, y2,c = 'g',label = 'Cosine')
leg = plt.legend()
ax.legend_ = None
plt.show()
|
Output:
We can see that there is no legend in the above figure.
Example 2: More than one subplot:
In the case of more than one subplot, we can mention the required subplot object for which we want to remove the legend. Here, we have written axs[0].legend_ = None which means we are removing legend for the first subplot specifically.the
Python3
import numpy as np
import matplotlib.pyplot as plt
x = np.linspace(-3, 3, 1000)
y1 = np.sin(x)
y2 = np.cos(x)
fig, axs = plt.subplots(2, 1)
axs[0].plot(x, y1, c = 'r',label = 'Sine')
axs[1].plot(x, y2,c = 'g',label = 'Cosine')
axs[0].legend(loc = 'upper left')
axs[1].legend(loc = 'upper left')
axs[0].legend_ = None
plt.show()
|
Output:
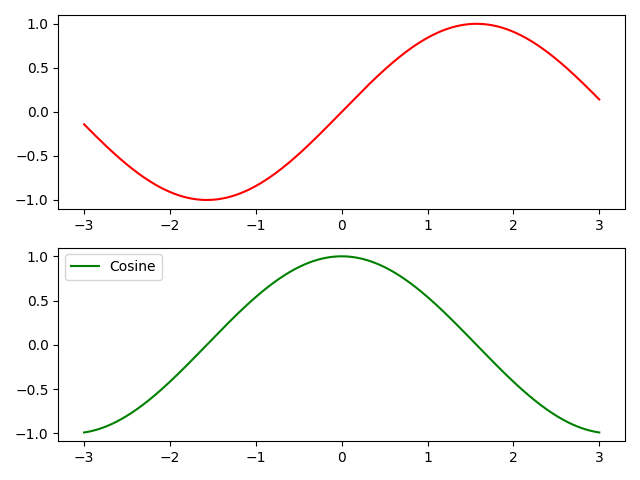
In the above figure, we removed legend for the first subplot specifically. The second subplot will still have legend.
Method 4: Using label = _legend_
Example 1: By sending label = ‘_nolegend_’ argument in ax.plot(), legend can be removed from figure in matplotlib.
Python3
import numpy as np
import matplotlib.pyplot as plt
x = np.linspace(-3, 3, 100)
y1 = np.power(x, 2)
y2 = np.power(x, 3)
fig, ax = plt.subplots()
ax.plot(x, y1, c = 'r',label = '_nolegend_')
ax.plot(x, y2,c = 'g',label = '_nolegend_')
leg = plt.legend()
plt.show()
|
Output:
Example-2. More than one subplots :
In case of more than one subplot, we can mention the required subplot object for which we want to remove the legend. Here, we have written axs[0].plot(x,y1,c=’r’,label = ‘_nolegend_’) which means we are removing legend for first subplot specifically.
Python3
import numpy as np
import matplotlib.pyplot as plt
x = np.linspace(-3,3,100)
y1 = np.power(x,2)
y2 = np.power(x,3)
fig, axs = plt.subplots(2,1)
axs[0].plot(x,y1,c='r',label = '_nolegend_')
axs[1].plot(x,y2,c='g',label = 'x^3')
axs[0].legend(loc='upper left')
axs[1].legend(loc='upper left')
plt.show()
|
Output :
In the above figure, we removed legend for the first subplot specifically. The second subplot will still have legend.
Share your thoughts in the comments
Please Login to comment...