Remove the legend border in Matplotlib
Last Updated :
29 May, 2021
In this article, we will learn how to Remove the legend border in Matplotlib. Let’s discuss some concepts :
- A legend is an area describing the elements of the graph. In the matplotlib library, there’s a function called legend() which is used to Place a legend on the axes.
Approach:
- Import Library (Matplotlib)
- Import / create data.
- Plot a chart.
- Add legend.
- Remove legend border.
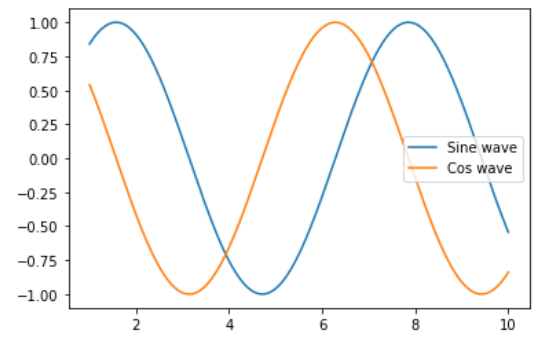
Example: Here is an example with legends.
Python3
import numpy as np
import matplotlib.pyplot as plt
x = np.linspace(1, 10, 1000)
y1 = np.sin(x)
y2 = np.cos(x)
plt.plot(x, y1)
plt.plot(x, y2)
plt.legend(['Sine wave', 'Cos wave'])
plt.show()
|
Output:
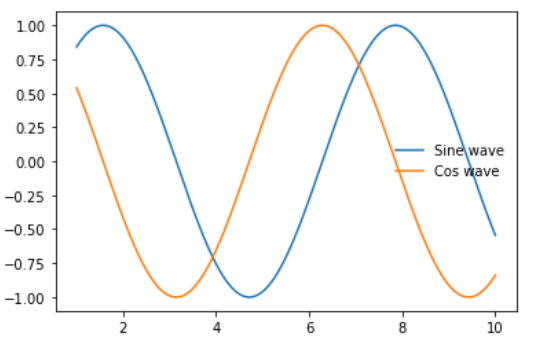
Method 1: (Using frameon = False)
Python3
import numpy as np
import matplotlib.pyplot as plt
x = np.linspace(1, 10, 1000)
y1 = np.sin(x)
y2 = np.cos(x)
plt.plot(x, y1)
plt.plot(x, y2)
plt.legend(['Sine wave', 'Cos wave'], frameon=False)
plt.show()
|
Output :
Method 2: (Using legend.get_frame().set_alpha(0))
Python3
import numpy as np
import matplotlib.pyplot as plt
x = np.linspace(1, 10, 1000)
y1 = np.sin(x)
y2 = np.cos(x)
plt.plot(x, y1)
plt.plot(x, y2)
leg = plt.legend(['Sine wave', 'Cos wave'])
leg.get_frame().set_alpha(0)
plt.show()
|
Output :
Share your thoughts in the comments
Please Login to comment...