Working with Missing Data in Pandas
Last Updated :
09 Feb, 2023
Missing Data can occur when no information is provided for one or more items or for a whole unit. Missing Data is a very big problem in a real-life scenarios. Missing Data can also refer to as NA(Not Available) values in pandas. In DataFrame sometimes many datasets simply arrive with missing data, either because it exists and was not collected or it never existed. For Example, Suppose different users being surveyed may choose not to share their income, some users may choose not to share the address in this way many datasets went missing.

In Pandas missing data is represented by two value:
- None: None is a Python singleton object that is often used for missing data in Python code.
- NaN : NaN (an acronym for Not a Number), is a special floating-point value recognized by all systems that use the standard IEEE floating-point representation
Pandas treat None and NaN as essentially interchangeable for indicating missing or null values. To facilitate this convention, there are several useful functions for detecting, removing, and replacing null values in Pandas DataFrame :
In this article we are using CSV file, to download the CSV file used, Click Here.
Checking for missing values using isnull() and notnull()
In order to check missing values in Pandas DataFrame, we use a function isnull() and notnull(). Both function help in checking whether a value is NaN or not. These function can also be used in Pandas Series in order to find null values in a series.
Checking for missing values using isnull()
In order to check null values in Pandas DataFrame, we use isnull() function this function return dataframe of Boolean values which are True for NaN values.
Code #1:
Python
import pandas as pd
import numpy as np
dict = {'First Score':[100, 90, np.nan, 95],
'Second Score': [30, 45, 56, np.nan],
'Third Score':[np.nan, 40, 80, 98]}
df = pd.DataFrame(dict)
df.isnull()
|
Output: 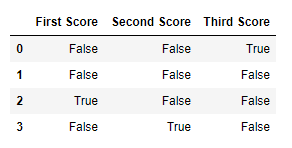
Code #2:
Python
import pandas as pd
data = pd.read_csv("employees.csv")
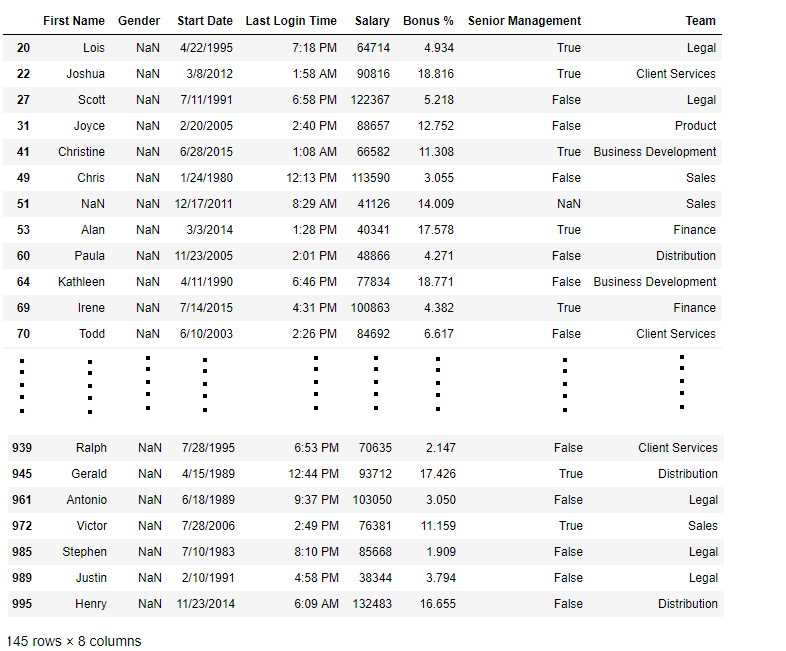
bool_series = pd.isnull(data["Gender"])
data[bool_series]
|
Output: As shown in the output image, only the rows having Gender = NULL are displayed.
Checking for missing values using notnull()
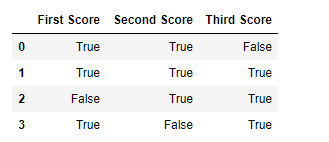
In order to check null values in Pandas Dataframe, we use notnull() function this function return dataframe of Boolean values which are False for NaN values.
Code #3:
Python
import pandas as pd
import numpy as np
dict = {'First Score':[100, 90, np.nan, 95],
'Second Score': [30, 45, 56, np.nan],
'Third Score':[np.nan, 40, 80, 98]}
df = pd.DataFrame(dict)
df.notnull()
|
Output:
Code #4:
Python
import pandas as pd
data = pd.read_csv("employees.csv")
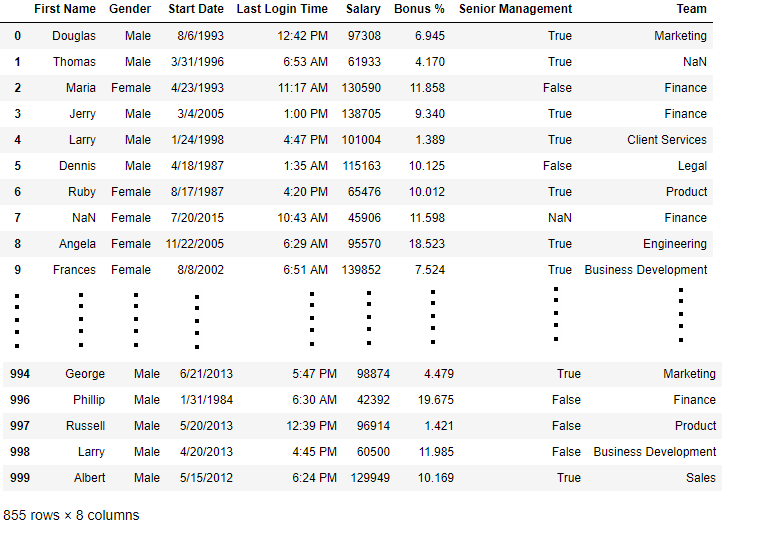
bool_series = pd.notnull(data["Gender"])
data[bool_series]
|
Output: As shown in the output image, only the rows having Gender = NOT NULL are displayed.
Filling missing values using fillna(), replace() and interpolate()
In order to fill null values in a datasets, we use fillna(), replace() and interpolate() function these function replace NaN values with some value of their own. All these function help in filling a null values in datasets of a DataFrame. Interpolate() function is basically used to fill NA values in the dataframe but it uses various interpolation technique to fill the missing values rather than hard-coding the value.
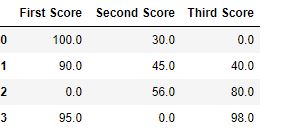
Code #1: Filling null values with a single value
Python
import pandas as pd
import numpy as np
dict = {'First Score':[100, 90, np.nan, 95],
'Second Score': [30, 45, 56, np.nan],
'Third Score':[np.nan, 40, 80, 98]}
df = pd.DataFrame(dict)
df.fillna(0)
|
Output:
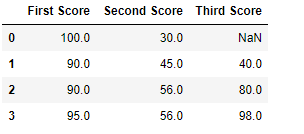
Code #2: Filling null values with the previous ones
Python
import pandas as pd
import numpy as np
dict = {'First Score':[100, 90, np.nan, 95],
'Second Score': [30, 45, 56, np.nan],
'Third Score':[np.nan, 40, 80, 98]}
df = pd.DataFrame(dict)
df.fillna(method ='pad')
|
Output:
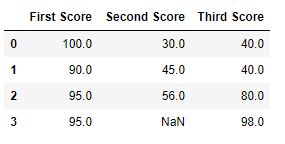
Code #3: Filling null value with the next ones
Python
import pandas as pd
import numpy as np
dict = {'First Score':[100, 90, np.nan, 95],
'Second Score': [30, 45, 56, np.nan],
'Third Score':[np.nan, 40, 80, 98]}
df = pd.DataFrame(dict)
df.fillna(method ='bfill')
|
Output:
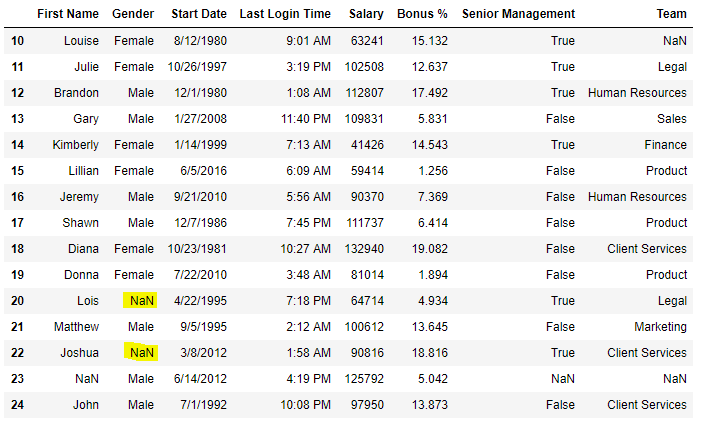
Code #4: Filling null values in CSV File
Python
import pandas as pd
data = pd.read_csv("employees.csv")
data[10:25]
|
Output
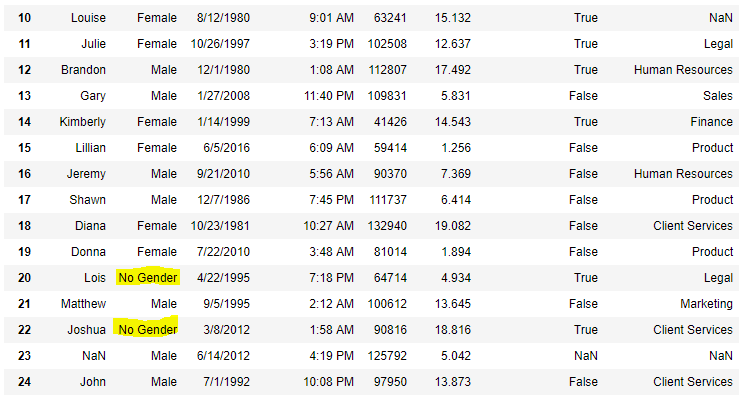
Now we are going to fill all the null values in Gender column with “No Gender”
Python
import pandas as pd
data = pd.read_csv("employees.csv")
data["Gender"].fillna("No Gender", inplace = True)
data
|
Output:
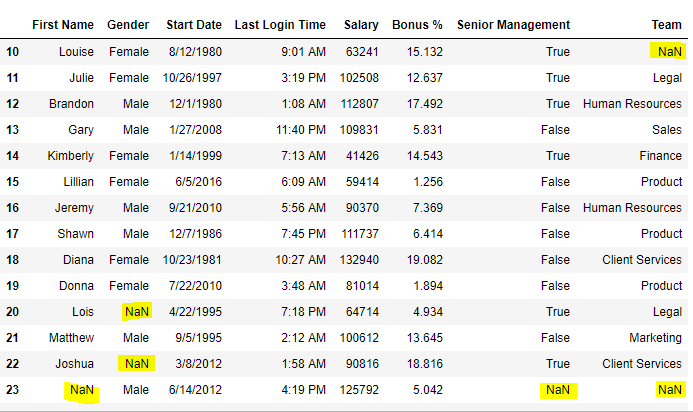
Code #5: Filling a null values using replace() method
Python
import pandas as pd
data = pd.read_csv("employees.csv")
data[10:25]
|
Output:
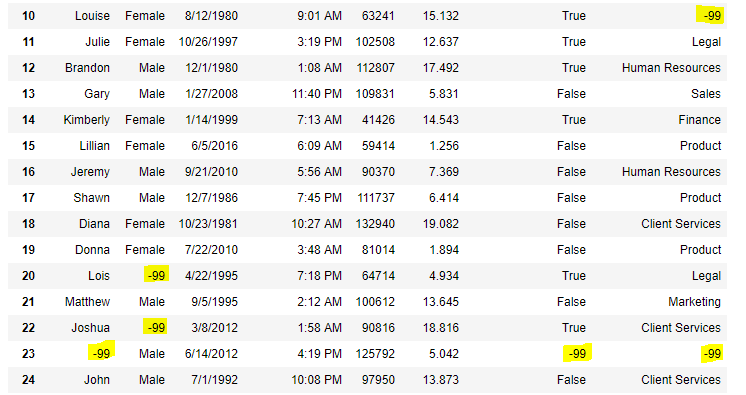
Now we are going to replace the all Nan value in the data frame with -99 value.
Python
import pandas as pd
data = pd.read_csv("employees.csv")
data.replace(to_replace = np.nan, value = -99)
|
Output:
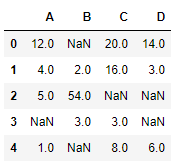
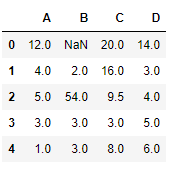
Code #6: Using interpolate() function to fill the missing values using linear method.
Python
import pandas as pd
df = pd.DataFrame({"A":[12, 4, 5, None, 1],
"B":[None, 2, 54, 3, None],
"C":[20, 16, None, 3, 8],
"D":[14, 3, None, None, 6]})
df
|
Output:
Let’s interpolate the missing values using Linear method. Note that Linear method ignore the index and treat the values as equally spaced.
Python
df.interpolate(method ='linear', limit_direction ='forward')
|
Output:
As we can see the output, values in the first row could not get filled as the direction of filling of values is forward and there is no previous value which could have been used in interpolation.
Dropping missing values using dropna()
In order to drop a null values from a dataframe, we used dropna() function this function drop Rows/Columns of datasets with Null values in different ways.
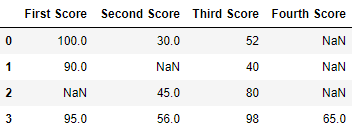
Code #1: Dropping rows with at least 1 null value.
Python
import pandas as pd
import numpy as np
dict = {'First Score':[100, 90, np.nan, 95],
'Second Score': [30, np.nan, 45, 56],
'Third Score':[52, 40, 80, 98],
'Fourth Score':[np.nan, np.nan, np.nan, 65]}
df = pd.DataFrame(dict)
df
|
Output
Now we drop rows with at least one Nan value (Null value)
Python
import pandas as pd
import numpy as np
dict = {'First Score':[100, 90, np.nan, 95],
'Second Score': [30, np.nan, 45, 56],
'Third Score':[52, 40, 80, 98],
'Fourth Score':[np.nan, np.nan, np.nan, 65]}
df = pd.DataFrame(dict)
df.dropna()
|
Output: 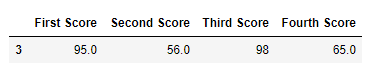
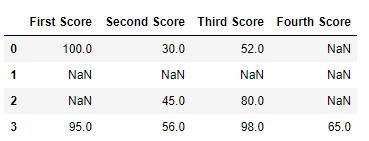
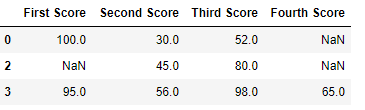
Code #2: Dropping rows if all values in that row are missing.
Python
import pandas as pd
import numpy as np
dict = {'First Score':[100, np.nan, np.nan, 95],
'Second Score': [30, np.nan, 45, 56],
'Third Score':[52, np.nan, 80, 98],
'Fourth Score':[np.nan, np.nan, np.nan, 65]}
df = pd.DataFrame(dict)
df
|
Output
Now we drop a rows whose all data is missing or contain null values(NaN)
Python
import pandas as pd
import numpy as np
dict = {'First Score':[100, np.nan, np.nan, 95],
'Second Score': [30, np.nan, 45, 56],
'Third Score':[52, np.nan, 80, 98],
'Fourth Score':[np.nan, np.nan, np.nan, 65]}
df = pd.DataFrame(dict)
df.dropna(how = 'all')
|
Output:
Code #3: Dropping columns with at least 1 null value.
Python
import pandas as pd
import numpy as np
dict = {'First Score':[100, np.nan, np.nan, 95],
'Second Score': [30, np.nan, 45, 56],
'Third Score':[52, np.nan, 80, 98],
'Fourth Score':[60, 67, 68, 65]}
df = pd.DataFrame(dict)
df
|
Output
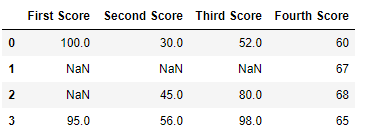
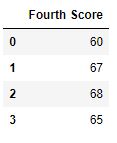
Now we drop a columns which have at least 1 missing values
Python
import pandas as pd
import numpy as np
dict = {'First Score':[100, np.nan, np.nan, 95],
'Second Score': [30, np.nan, 45, 56],
'Third Score':[52, np.nan, 80, 98],
'Fourth Score':[60, 67, 68, 65]}
df = pd.DataFrame(dict)
df.dropna(axis = 1)
|
Output :
Code #4: Dropping Rows with at least 1 null value in CSV file
Python
import pandas as pd
data = pd.read_csv("employees.csv")
new_data = data.dropna(axis = 0, how ='any')
new_data
|
Output:
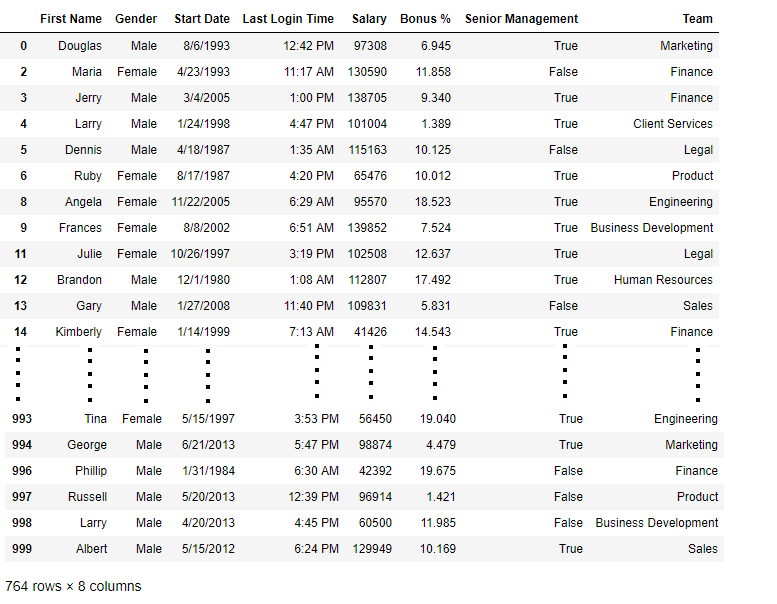
Now we compare sizes of data frames so that we can come to know how many rows had at least 1 Null value
Python
print("Old data frame length:", len(data))
print("New data frame length:", len(new_data))
print("Number of rows with at least 1 NA value: ", (len(data)-len(new_data)))
|
Output :
Old data frame length: 1000
New data frame length: 764
Number of rows with at least 1 NA value:  236
Since the difference is 236, there were 236 rows which had at least 1 Null value in any column.
Share your thoughts in the comments
Please Login to comment...