Graphing slope-intercept equations – Straight Lines | Class 11 Maths
Last Updated :
05 Nov, 2020
To graph a straight line we need at least two points which lie on the straight line. From the slope-intercept form of the given straight line, we can calculate two points on the line very easily using the information present in the equation. Consider a straight line with slope m and y-intercept c. We know the slope-intercept form of the equation of this straight line is: y = mx + c. Here y-intercept c indicates that the line has cut the Y-axis on a distance of c from the origin, which further implies that the cutting point is (0, c). Now we have a fixed point on the line which we can plot in the graph. Using this point and the slope of the straight line we can draw a graph of the straight line.
Graphing slope-intercept form
Now we have a fixed point on the line which is the cutting point with coordinate (0, c). To determine the second point we need to use the slope of the line which is m for the considered straight line.
We know,
Slope = change in y/change in x
Let the slope m = p/q
If m is in fraction form then p is the numerator and q is the denominator. If m is an integer then we can always take m as numerator(p) and 1 as denominator(q)(as m/1 = m).
p/q = change in y/change in x
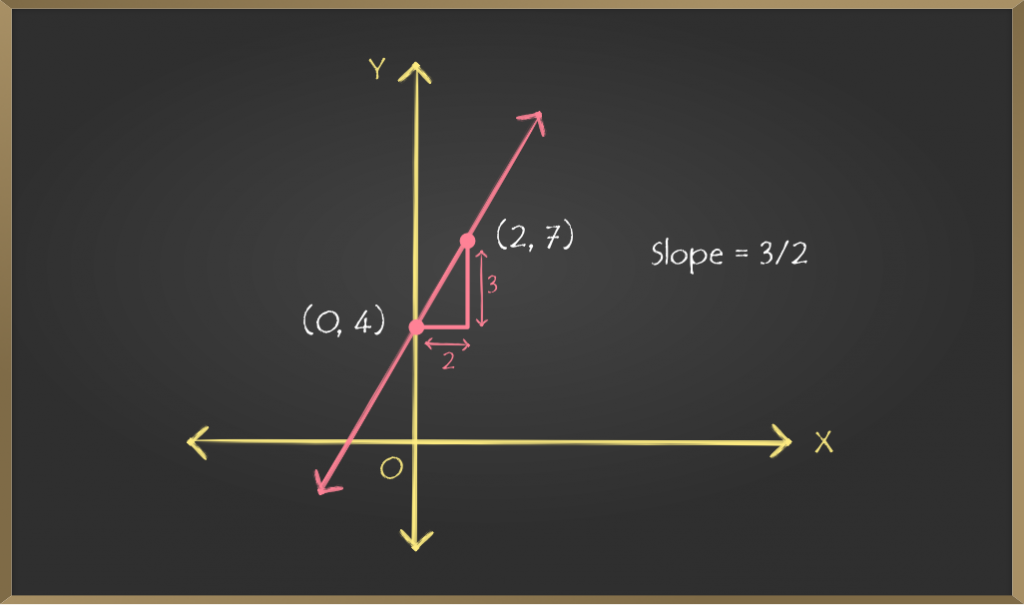
which further implies that q units change in x−coordinate will result p units change in y−coordinate. Thus, if point (x, y) lies on the straight line, then point (x + q, y + p) will also lie on that line. For the considered line, we know (0, c) lies on the line and p/q (m = p/q) is the slope of the line. As discussed above, point (0 + q, c + p) or point (q, c + p) will also lie on that line. Now we can plot these two points on the graph and joining them will give us the required straight line. For further clarification, see above image where m = p/q = 3/2 and c = 4.
Sample Problems on Graph Plotting
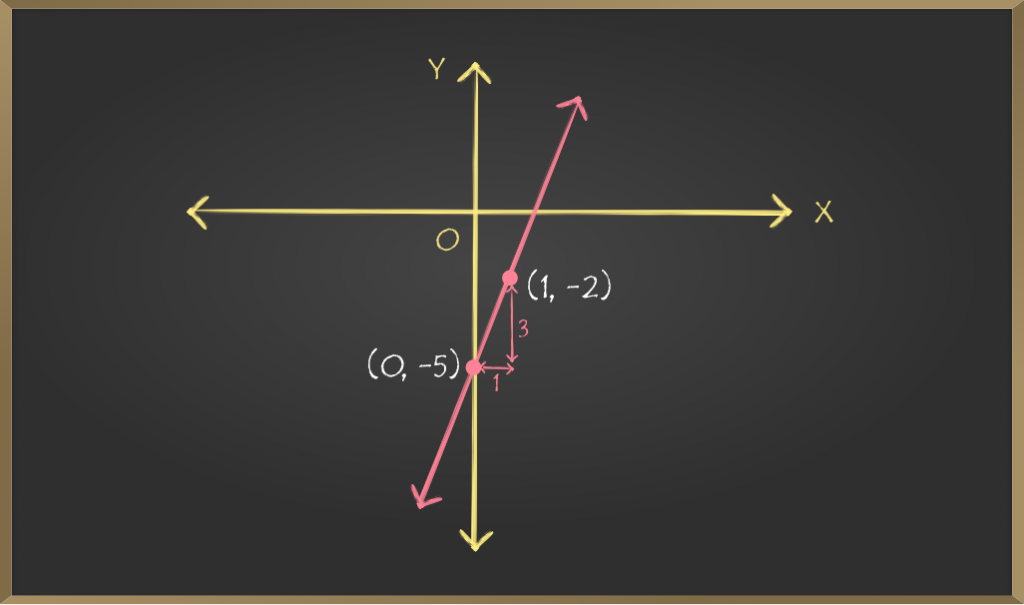
Problem 1: Plot a Graph for Slope intercept equation, y = 3x – 5.
Solution:
Comparing given equation with y = mx + c we get,
m = 3 ⇒ p/q = 3/1 ⇒ p = 3, q = 1 and c = -5
c = -5 implies that y-intercept of the line is -5, i.e.
the line cuts the Y-axis on the point (0, -5)
m = 3 or p/q = 3/1 implies that slope of the line is 3,
i.e. 1 unit change in x-coordinate will result 3 units
change in y-coordinate. Thus, if point (x, y) lies on
the given straight line then point (x +1, y +3) will also
lie on that line.
⇒ Point (0, -5) and point (0+1, -5+3) ⇒(1, -2)
lies on the given straight line. Joining these two
points will give us the required line.
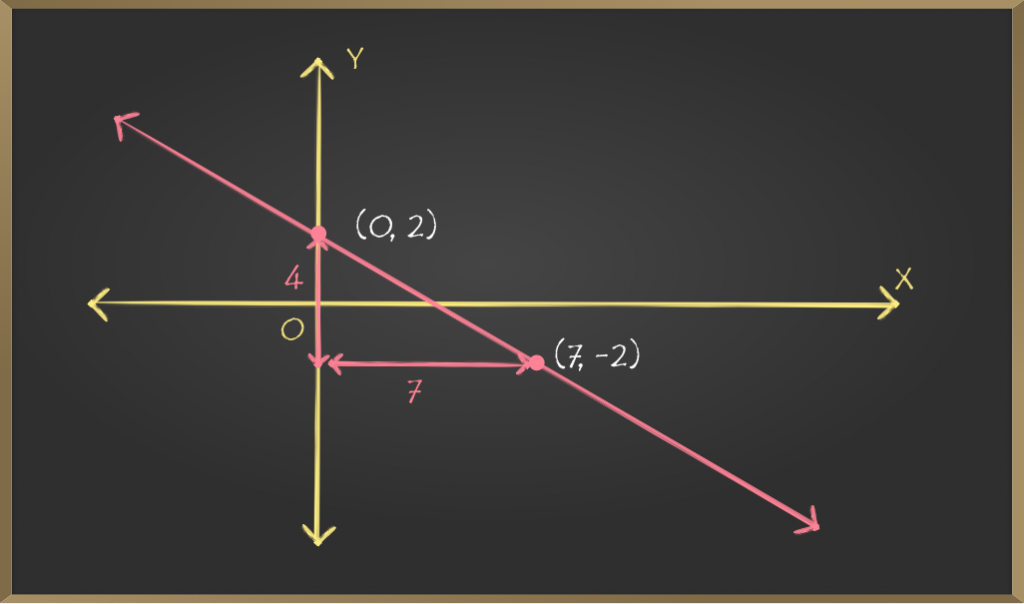
Problem 2: Plot a Graph for Slope intercept equation y = -(4/7)x + 2.
Solution:
Comparing given equation with y = mx + c we get,
m = -(4/7) ⇒ p/q ⇒ -(4/7) ⇒ p = -4, q = 7 and c = 2
⇒ Point (0, 2) and point (0 + 7, 2 – 4) ⇒(7, -2)
lies on the given straight line. Joining these two
points will give us the required line.
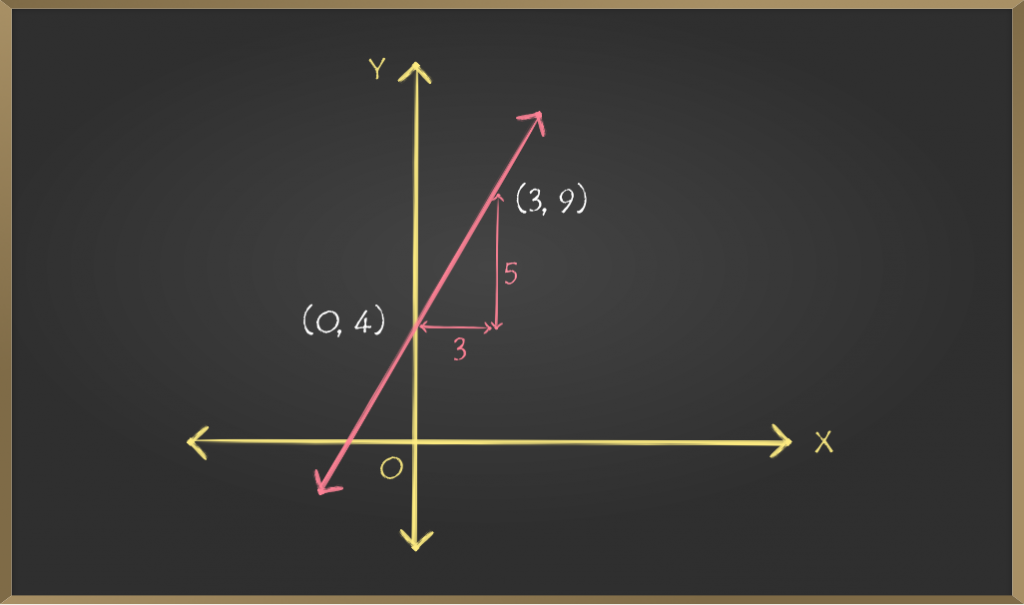
Problem 3: Plot a Graph for Slope intercept equation y = (5/3)x + 4.
Solution:
Comparing given equation with y = mx + c we get,
m = 5/3 ⇒ p/q ⇒ 5/3 ⇒ p = 5, q = 3 and c = 4
⇒ Point (0, 4) and point (0+3, 4+5) ⇒(3, 9)
lies on the given straight line. Joining these two
points will give us the required line.
Summary
- Slope-intercept form of a straight line is: y = mx + c, where m is the slope and c is y-intercept.
- Slope-intercept form is useful to graph a straight line.
- From the slope-intercept form y = mx + c we can determine two points on the line which are (0, c) and (q, c + p), where p/q = m. Joining these points will give us the required straight line.
Share your thoughts in the comments
Please Login to comment...