Graphing Function is the process of illustrating the graph (the curve) for the function that corresponds to it. Plotting simple functions like linear, quadratic, cubic, et al. examples doesn’t pose a challenge; depicting functions of a more complex nature like rational, logarithmic, and others requires some skill and some mathematical knowledge to understand them correctly.
In this part, you will be introduced to the joining path of the graphing function, where, in addition to its role as a hunting ground for space in the different fields of mathematics, its application in economics and engineering.
What is Meant By Graphing Functions?
Graphing functions are when we draw the curve that is taken by the function on a coordinate plane. Suppose that a curve (graph) only represents a function; then every point on the curve should also be a value of the function equation.
For instance, the respective graph of the linear function is shown below. It is represented as f(x)= -x + 2.
-(2).jpg)
For instance, suppose we move from the start of this line to another point, such as (-1, 3). Let us replace (-1, 3) by (x, y) (for example, x = -1 and y = 3) and then, in f(x) = -x + 2, switch the roles of variables (now this can also be denoted as y = -x + 2). Then
- 3 = 3, thus, (-1, 3) satisfies the function.
Similarly, make similar points and look to see if they work in the equation. Every curve point (commonly called “line”), in particular, is the function that is used. This process of making such curves that are involved in the topic of function is popularly known by the name graphing functions.
Graphing Basic Functions
Creating and analyzing simple functions like linear functions and quadratic functions is straightforward. The fundamental concept of graphing for functions in math.
- In this case, find out the mold if possible. There is an example to make things clear: if it is a linear function of the form f(x) = ax + b, then its graph will be a line, and if it is a quadratic function of the type f(x) = ax2 + bx + c, then its graph will be a parabola.
- By selecting some points on it, you can replace these points with the corresponding values’ substitution by the function for each value.
Here are some examples.
Graphing Linear Functions
What about doing the same thing as in the previous section but only with the linear function plotted: (f(x) = -x + 2) Consequently, we create a table of values by selecting some random numbers x=0 and x = 1. Now, substitute the values and pass each as an argument to the expression y = -x + 2 to compute the y values.
|
X
|
Y
|
|
0
|
-0 + 2 = 2
|
|
1
|
-1 + 2 = 1
|
Thus, two points on the line are (0, 2) and (1, 1). If we plot them on a graph and join them by a straight line (extending the line on both sides), we get its graph as shown in the previous section.
Graphing Quadratic Functions
For graphing quadratic functions also, we can find some arbitrary points on it. But this may not give a perfect U-shaped wind. This is because, to get a perfect U-shaped wind, we need where the wind is turning. i.e., we’ve to find its vertex. After changing the vertex, we can find two or three arbitrary points on each side of the vertex and they would help in graphing the function.
Example: Graph the quadratic function f( x) = x2– 2x + 5.
Solution:
- Comparing it with f( x) = ax2 + bx + c, a = 1, b = -2, and c = 5.
- Thex-coordinate of the vertex is, h = – b/ 2a = -(- 2)/ 2( 1) = 1.
- Its y- match is, f( 1) = 12 – 2( 1) + 5 = 4.
Hence, the vertex is( 1, 4).
We’ll take two arbitrary figures on each side of 1( which is the x-coordinate of the vertex) and frame a table. also, we can calculate the y- y-equals using the function.
|
X
|
Y
|
|
-1
|
(-1)2 – 2(-1) + 5 = 8
|
|
0
|
02 – 2(0) + 5 = 5
|
|
Vertex: 1
|
4
|
|
2
|
22 – 2(2) + 5 = 5
|
|
3
|
32 – 2(3) + 5 = 8
|
Now, we will compass the points(- 1, 8), (0, 5), (1, 4), (2, 5), and (3, 8) on a graph distance, join them, and extend the wind on both sides.
.jpg)
Graphing Complex Functions
Grasping functions take a simpler path if their domain and range both consist of all real numbers. However, there is an exception for not all types of functions with a variety of shows. Some of the functions determined in domains, ranges, asymptotes, and holes are altered to be graphed. The most popular such functions are:
- Rational functions: Its general function is of the form f(x) = 1/ x (which is called the complementary function).
.png)
In each of these cases, for graphing functions, we follow the following steps:
- Find the domain and range of the function and keep them in mind while drawing the curve.
- Find the x-intercept(s) and the y-intercept(s), and plot them.
- Identify the holes, if any.
- Find the asymptotes (vertical, horizontal, and slant) and draw them with dotted lines so that we can break the graph along those lines and make sure that the graph doesn’t touch them.
- Construct a table of values by taking some random numbers for x (on both sides of the x-intercept and/or on both sides of the vertical asymptote) and calculating the corresponding values for y.
- Plot the points from the table and join them by taking care of asymptotes, domain, and range.
- Let us see how to graph a function in different cases using the above steps.
Let us see how to graph a function in different cases using the below way.
Graphing Rational Functions
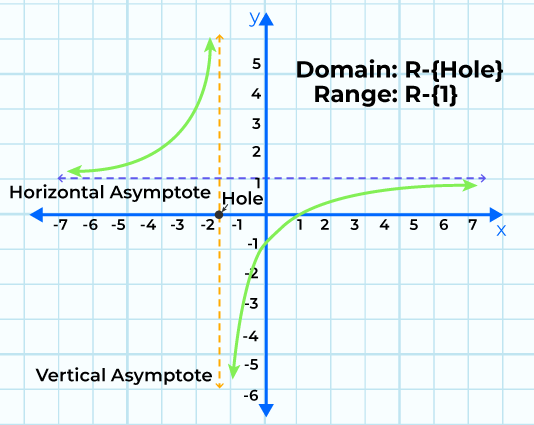
For example, draw a rational function f(x) = (x + 1)/(x – 2). Subsequently, we implement the above procedure and graph that vertical line function.
- Set of domains = {x ∈ R | x ≠ 2}; set of ranges = {y ∈ R | y ≠ 1}. If you want to get the domain and range of a rational function,
- Its x-intercept is (-1, 0), and the -axis’s y-intercept is (0, -0.5).
- Vertical asymptote (VA) x = 2, horizontal asymptote (VA) y = 1.
- Consider, say, these two points to be p and q on each side of the y axis that contains the vertical asymptote x = 2, then find their y – values.
|
X
|
Y
|
|
-1
|
(-1+1)/(-1-2) = 0 (x-int)
|
|
0
|
(0+1)/(0-2) = -0.5 (y-int)
|
|
2
|
VA
|
|
3
|
(3+1)/(3-2) = 4
|
|
4
|
(4+1)/(4-2) = 2.5
|
- Let us plot all these points along with VA and HA
-(1).jpg)
Graphing Exponential Functions
Imagine that we have a function f(x) = 2-x + 2, which has exponential form. Let us graph it using the very steps we pointed out earlier.
- Its definition class covers all real numbers in the in the domain, and the range is the set of y values that are greater than 2. To look for educational institutions, use this menu.
- It possesses bilateral symmetry. Yet it includes a horizontal asymptote at y = 2.
- It has no x-intercepts. Its y-intercept is, therefore, (0,3).
- We do not have data about VA or x-intercept. We only have one data so far which is (0, 3). So let us take some random numbers on both sides of x = 0 and frame a table.
|
X
|
Y
|
|
-2
|
2-(-2) + 2 = 6
|
|
-1
|
2-(-1) + 2 = 4
|
|
0
|
3 (y-int)
|
|
1
|
2-1 + 2 = 2.5
|
|
2
|
2-2 + 2 = 2.25
|
- Let us plot all the information on the graph.
.jpg)
Graphing Logarithmic Functions
To graph a logarithmic curve, choose the function, for example, f(x) = 2log2x – 2. We can now sketch this chemical reaction by following the steps demonstrated before.
- Its domain is x > 0, and its range is the set of all real numbers (R).
- Its x-int is (2, 0), and there is no y-int.
- Its vertical asymptote is y = 0 (x-axis) and there is no horizontal asymptote.
We’ve only one reference point so far which is( 2, 0). We’ll construct a table by taking many arbitrary figures on either side of 0( we can not choose values of x lower than 0 as the sphere is x> 0).
|
X
|
Y
|
|
1
|
2 log2 1 – 2 = -2
|
|
2
|
0 (x-int)
|
|
4
|
2 log2 4 – 2 = 2
|
Note that we’ve chosen similar figures for x that make it easy to simplify the y- y-values.
- We will plot the graph now.
-(1).jpg)
We can graph the functions by applying metamorphoses on the graphs of the parent functions. Then are the parent functions of many important types of functions.
- Linear function f( x) = x
- Quadratic function f( x) = x2
- Boxy functions f( x) = x3
- Forecourt root function f( x) = √ x
- cell root function f( x) = ∛ x
- Absolute value function f( x) = | x|
- Complementary function f( x) = 1/ x
- Exponential function f( x) = layoff, 0< a< 1
- Logarithmic function f( x) = log x
We need to have an idea about what the graph of each of these parent functions looks like( by clicking on the separate links). also, we can apply the following metamorphoses to graph the given function.
|
X
|
Y
|
|
f(x) + c
|
It shifts the graph of the function c units upward.
|
|
f(x) – c
|
It shifts the graph of the function c units downward.
|
|
f(x + c)
|
It shifts the graph of the function c units to the left.
|
|
f(x – c)
|
It shifts the graph of the function c units to the right.
|
|
-f(x)
|
It reflects the graph of the function on the x-axis (upside down).
|
|
f(-x)
|
It reflects the graph of the function in the y-axis (i.e., the left and right sides are swapped).
|
|
f(ax)
|
Horizontal dilation by a factor of 1/a.
|
Graphing Functions Examples
Example 1: Determine which of the following points lie on the graph of function f( x) = 2x3 – 2? ( a)( 1, 1)( b)( 1, 0)( c)( 2, 6).
Solution:
We’ll substitute each point in the given function to see which of them satisfies the function.
a)( 1, 1) = ( x, f( x))
1 = 2( 1) 3– 2
1 = 2- 2
1 = 0, not satisfied
So( 1, 1) is NOT on the graph of the function.
b)( 1, 0) = ( x, f( x))
0 = 2( 1) 3– 2
0 = 2- 2
0 = 0, satisfied
So( 1, 1) is on the graph of the function.
c)( 2, 6) = ( x, f( x))
6 = 2( 2) 3– 2
6 = 16- 2
6 = 14, not satisfied
So( 2, 6) is NOT on the graph of the function.
Answer: Only( b) lies on the given function.
Example 2: Does the graph given in illustration 1 have any asymptotes? Explain. How numerous corridors does it have?
Solution:
The given function is f( x) = 2x3– 2, which is a polynomial function and hence it has no asymptotes.
When there are no asymptotes, we will get only one wind( as the wind does not break anywhere) while graphing functions.
Answer: No asymptotes and only one wind.
Example 3: Draw the graph of the function given in Example 1 along with the point( s) you set up from its result.
Solution:
In illustration 1, we’ve formerly set up that( 1, 0) lies on the function f( x) = 2×3- 2. For graphing functions, we need further points. Let us construct a table for the same.
|
X
|
Y
|
|
-1
|
2(-1)3 – 2 = -4
|
|
0
|
2(0)3 – 2 = -2
|
Let us plot these points along with (1, 0) and plot it.
-(1).jpg)
Answer: The graph is drawn.
Practice Questions on Graphing Functions
1. Draw the graph of following functions:
- f(x) = x2 − 2
- f(x) = 9
- f(x) = √x + 1
2. Graph the cosine function y = cos(x) for 0 ≤ x ≤ 2π
3. Plot the tangent function y = tan(x) over the interval −π/2 ≤ x ≤ π/2
FAQs on Graphing Functions
What is a Function?
A function is a fine relationship between two sets of figures, where each input( independent variable) corresponds to exactly one affair( dependent variable).
What’s Graphing a Function?
Graphing a function involves conniving the points that represent the relationship between the input and affair values of the function on a matching airplane. This creates a visual representation of the function.
How Do I Graph a Direct Function?
A direct function has the form f( x) = mx + b, where m is the pitchand b isth they-interceptt. To graph a direct function ,plot the intercept on the axiss and use the pitch to find fresh points. Connect the points to form a straight line.
What’s The Pitch of a Function?
The pitch of a function measures the rate of change between the input and affair variables. It represents the steepness of the line on the graph. For a direct function, the pitch is constant.
How Do I Graph a Quadratic Function?
A quadratic function has the form f( x) = ax2 + bx + c, where a, b, and c are constants. To graph a quadratic function, you can use the vertex form f( x) = a( x − h)2 + k to find the vertex, axis of harmony and direction of opening. Plot the vertex and at least two other points, also draw a smooth wind passing through these points.
What are The Crucial Features of a Function’s Graph?
Crucial features of a function’s graph include theintercepts-interceptsa y-interceptss), vertex( for quadratic functions), sphere and range, harmony( if applicable), adding and dwindling intervals, and any asymptotes.
How Do I Find The Sphere And Range of a Function?
The sphere of a function is the set of all possible input values(x-values) for which the function is defined. The range is the set of all possible affair values( y- values). To find the sphere, consider any restrictions on the function, similartos division by zero or square roots of negative figures. The range can frequently be determined by observing the geste of the graph.
What Are Metamorphoses of Functions?
Metamorphoses of functions involve shifting, stretching, or reflecting the graph of a function. Common metamorphoses include restatements( shifts), dilations( stretching or shrinking), andreflections acrosss the-axiss ory-axiss.
How Do I Graph Piecewise Functions?
Piecewise functions have different rules for different intervals of the input variable. To graph a piecewise function, graph each piece independently according to its rule and interval, also combine the graphs on the same match airplane.
Share your thoughts in the comments
Please Login to comment...