ANOVA (Analysis of Variance) Test in R Programming
Last Updated :
02 Apr, 2024
ANOVA also known as Analysis of variance is used to investigate relations between categorical variables and continuous variables in the R Programming Language. It is a type of hypothesis testing for population variance. It enables us to assess whether observed variations in means are statistically significant or merely the result of chance by comparing the variation within groups to the variation between groups. The ANOVA test is frequently used in many disciplines, including business, social sciences, biology, and experimental research.
R – ANOVA Test
ANOVA tests may be run in R programming, and there are a number of functions and packages available to do so.
ANOVA test involves setting up:
- Null Hypothesis: The default assumption, or null hypothesis, is that there is no meaningful relationship or impact between the variables. It stands for the absence of a population-wide link, difference, or effect. The statement that two or more groups are equal or that the effect size is zero is sometimes expressed as the null hypothesis. The null hypothesis is commonly written as H0.
- Alternate Hypothesis: The opposite of the null hypothesis is the alternative hypothesis. It implies that there is a significant relationship, difference, or link among the population’s variables. Depending on the study question or the nature of the issue under investigation, it may take several forms. Alternative hypotheses are sometimes referred to as H1 or HA.
ANOVA tests are of two types:
- One-way ANOVA: One-way When there is a single categorical independent variable (also known as a factor) and a single continuous dependent variable, an ANOVA is employed. It seeks to ascertain whether there are any notable variations in the dependent variable’s means across the levels of the independent variable.
- Two-way ANOVA: When there are two categorical independent variables (factors) and one continuous dependent variable, two-way ANOVA is used as an extension of one-way ANOVA. You can evaluate both the direct impacts of each independent variable and how they interact with one another on the dependent variable.
The Dataset
The mtcars(motor trend car road test) dataset is used which consist of 32 car brands and 11 attributes. The dataset comes preinstalled in dplyr package in R.
To get started with ANOVA, we need to install and load the dplyr package.
Performing One Way ANOVA test in R language
One-way ANOVA test is performed using mtcars dataset which comes preinstalled with dplyr package between disp attribute, a continuous attribute and gear attribute, a categorical attribute.here are some steps.
- Setup Null Hypothesis and Alternate Hypothesis
- H0 = mu = mu01 = mu02(There is no differencebetween average displacement for different gears)
- H1 = Not all means are equal.
R
install.packages("dplyr")
library(dplyr)
head(mtcars)
|
Output:
                   mpg cyl disp  hp drat    wt  qsec vs am gear carb
Mazda RX4         21.0   6  160 110 3.90 2.620 16.46  0  1    4    4
Mazda RX4 Wag     21.0   6  160 110 3.90 2.875 17.02  0  1    4    4
Datsun 710        22.8   4  108  93 3.85 2.320 18.61  1  1    4    1
Hornet 4 Drive    21.4   6  258 110 3.08 3.215 19.44  1  0    3    1
Hornet Sportabout 18.7   8  360 175 3.15 3.440 17.02  0  0    3    2
Valiant           18.1   6  225 105 2.76 3.460 20.22  1  0    3    1
Here we will print top 5 record of our dataset to get an idea about our dataset.
Perform the ANOVA test using aov function.
R
mtcars_aov <- aov(mtcars$disp~factor(mtcars$gear))
summary(mtcars_aov)
|
Output:
                    Df Sum Sq Mean Sq F value   Pr(>F)
factor(mtcars$gear)  2 280221  140110   20.73 2.56e-06 ***
Residuals           29 195964    6757
---
Signif. codes:  0 ‘***’ 0.001 ‘**’ 0.01 ‘*’ 0.05 ‘.’ 0.1 ‘ ’ 1
- Df: The model’s degrees of freedom.
- Sum Sq: The sums of squares, which represent the variability that the model is able to account for.
- Mean Sq: The variance explained by each component is represented by the mean squares.
- F-value: It is the measure used to compare the mean squares both within and between groups.
- Pr(>F): The F-statistics p-value, which denotes the factors’ statistical significance.
- Residuals: Relative deviations from the group mean, are often known as residuals and their summary statistics.
Identifier codes: Asterisks (*) are used to show the degree of significance; they stand for p 0.05, p 0.01, and p 0.001, respectively.
Performing Two Way ANOVA test in R
A two-way ANOVA test is performed using mtcars dataset which comes preinstalled with dplyr package between disp attribute, a continuous attribute and gear attribute, a categorical attribute, am attribute, a categorical attribute.
- Setup Null Hypothesis and Alternate Hypothesis
- H0 = mu0 = mu01 = mu02(There is no difference between average displacement for different gear)
- H1 = Not all means are equal
R
install.packages("dplyr")
library(dplyr)
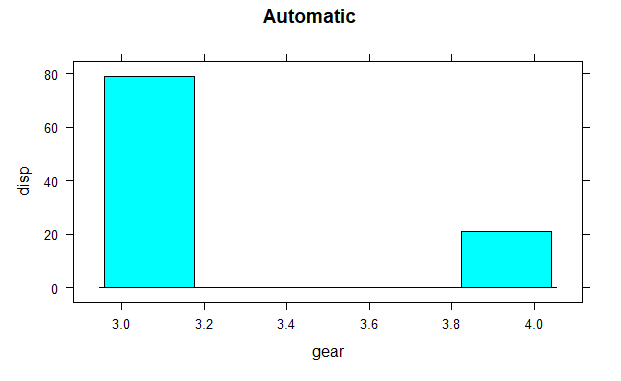
histogram(mtcars$disp~mtcars$gear, subset = (mtcars$am == 0),
xlab = "gear", ylab = "disp", main = "Automatic")
histogram(mtcars$disp~mtcars$gear, subset = (mtcars$am == 1),
xlab = "gear", ylab = "disp", main = "Manual")
|
Output:
ANOVA Test in R Programming

ANOVA Test in R Programming
The histogram shows the mean values of gear with respect to displacement. Hear categorical variables are gear and am on which factor function is used and continuous variable is disp.
Calculate test statistics using aov function
R
mtcars_aov2 <- aov(mtcars$disp~factor(mtcars$gear) *
factor(mtcars$am))
summary(mtcars_aov2)
|
Output:
                    Df Sum Sq Mean Sq F value   Pr(>F)
factor(mtcars$gear)  2 280221  140110  20.695 3.03e-06 ***
factor(mtcars$am)    1   6399    6399   0.945    0.339
Residuals           28 189565    6770
---
Signif. codes:  0 ‘***’ 0.001 ‘**’ 0.01 ‘*’ 0.05 ‘.’ 0.1 ‘ ’ 1
The summary shows that the gear attribute is very significant to displacement(Three stars denoting it) and am attribute is not much significant to displacement. P-value of gear is less than 0.05, so it proves that gear is significant to displacement i.e related to each other. P-value of am is greater than 0.05, am is not significant to displacement i.e not related to each other.
Find the best-fit model
We have two different anova models and we will try to find the best fit model based on their AIC score.
The Akaike Information Criterion (AIC), which accounts for the number of predictors, is a gauge of a model’s goodness of fit. It penalizes more intricate models in order to prevent overfitting. Better-fitting models are indicated by lower AIC values.
R
library(AICcmodavg)
model.set <- list(mtcars_aov, mtcars_aov2)
model.names <- c("mtcars_aov", "mtcars_aov2")
aictab(model.set, modnames = model.names)
|
Output:
Model selection based on AICc:

            K   AICc Delta_AICc AICcWt Cum.Wt      LL
mtcars_aov  4 379.33       0.00   0.71   0.71 -184.93
mtcars_aov2 5 381.10       1.76   0.29   1.00 -184.39
- AICc (Corrected AIC): AICc is a measure of how well a statistical model fits the data. Lower AICc values indicate better-fitting models.
- Delta_AICc (Difference in AICc): This column represents the difference in AICc between each model and the best-fitting model. Smaller values are better, and a difference of 2 or more is considered significant.
- AICcWt (AICc Weight): AICc weight indicates the probability that a given model is the best among the ones considered. In your table, the model with the highest AICc weight (0.71) is considered the most likely best model.
- Cum.Wt (Cumulative AICc Weight): This shows the cumulative probability that any model up to a particular row is the best-fitting model.
- LL (Log-Likelihood): Log-likelihood measures how well a model explains the observed data. Higher values mean a better fit.
Plot the results in a graph
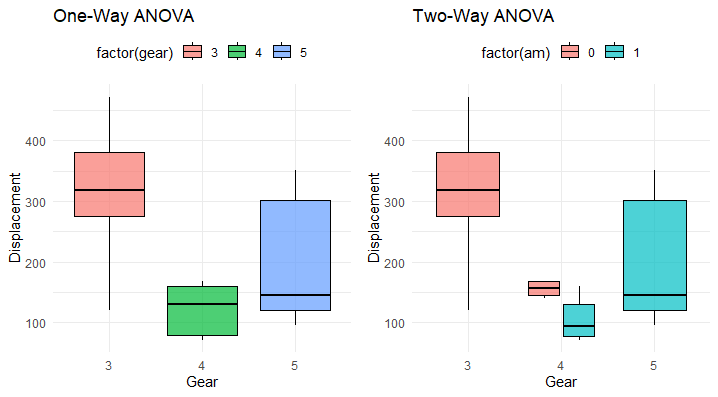
We will plot both the model together so find out the compression of both the models. here we will use ggplot library and plot the box plot and visualize our both models.
R
install.packages("ggplot2")
library(ggplot2)
plot1 <- ggplot(mtcars, aes(x = factor(gear), y = disp, fill = factor(gear))) +
geom_boxplot(color = "black", alpha = 0.7) +
labs(title = "One-Way ANOVA",
x = "Gear",
y = "Displacement") +
theme_minimal() +
theme(legend.position = "top")
plot2 <- ggplot(mtcars, aes(x = factor(gear), y = disp, fill = factor(am))) +
geom_boxplot(color = "black", alpha = 0.7) +
labs(title = "Two-Way ANOVA",
x = "Gear",
y = "Displacement") +
theme_minimal() +
theme(legend.position = "top")
library(gridExtra)
grid.arrange(plot1, plot2, ncol = 2)
|
Output:
Anova Test In R
The box plots visually compare the displacement (disp) distribution across different gear levels for both one-way and two-way ANOVA models. In the one-way ANOVA, each box represents a gear level, showcasing the variability in displacements.
The two-way ANOVA extends this comparison, incorporating the additional factor (am), providing a more detailed insight into how both factors collectively influence displacement. The plots help discern any notable differences or patterns in dispersion, aiding in the interpretation of model effects on the response variable.
Results
We see significant results from boxplots and summaries.
- Displacement is strongly related to Gears in cars i.e displacement is dependent on gears with p < 0.05.
- Displacement is strongly related to Gears but not related to transmission mode in cars with p 0.05 with am.
Share your thoughts in the comments
Please Login to comment...