Type II Error in Upper Tail Test of Population Mean with Unknown Variance in R
Last Updated :
02 Jun, 2022
Conventionally, In an upper-tail test, the null hypothesis states that the true population mean (μo) is less than the hypothesized mean value (μ). We fail to reject the null hypothesis if the test statistic is lesser than the critical value at the chosen significance level. In this article let us discuss the probability percentage of type II error for an upper-tail test of the population mean with known variance.
Type II error is an error that occurs if the hypothesis test based on a random sample fails to reject the null hypothesis even when the true population mean μo is greater than the hypothesized mean value μ.
Here the assumption is the population variance σ2 is unknown. Let s2 be the sample variance. For larger n (usually >30), the population of the following statistics of all possible samples of size n is approximately a Student t distribution with n – 1 degree of freedom (DOF).
The range of sample means for a student t distribution is calculated as follows
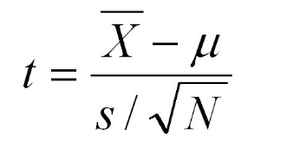
test statistic
The above formulation helps us to compute the range of sample means for which the null hypothesis will not be rejected and thereby calculate the probability of type II error.
Let us try to understand the type II error by considering a case study.
Assume the data labeling company states that there are less than 2 errors in marked labels on any single page. Assume the actual mean amount of error per page 2.12, and the sample standard deviation is 0.2. At the .05 significance level, what is the probability of having a type II error for a sample size of 40 pages?
Example:
Let us start by computing the standard error of the mean as shown
R
n = 40
s = 0.2
SE = s/sqrt(n);
SE
|
Output:
0.0316227766016838
Then compute the upper bound of sample means for which the null hypothesis μo ≤ 2 would not be rejected.
R
alpha = .05
mu0 = 2
q = mu0 + qt(alpha, df=n-1, lower.tail=FALSE) * SE;
q
|
Output:
2.05328042957561
The upper bound value denotes, that as long as the sample mean is less than 2.05328 in a hypothesis test, the null hypothesis will not be rejected. Let’s try and compute the probability of the sample mean being below 2.05328 because we have assumed the actual population mean as 2.12. This probability can further be used to compute the probability of type II error.
R
mu = 2.12
pt((q - mu)/SE, df=n-1)
|
Output:
0.0206695278070304
If the sample size is 40, the actual mean amount of errors per page is 2.12 and the sample standard deviation is 0.2, then the probability of type II error for testing the null hypothesis μ ≤ 2 at a .05 significance level is 2.06%, and the power of the hypothesis test is 97.93%.
Like Article
Suggest improvement
Share your thoughts in the comments
Please Login to comment...