K-mode clustering is an unsupervised machine-learning technique used to group a set of data objects into a specified number of clusters, based on their categorical attributes. The algorithm is called “K-Mode” because it uses modes (i.e. the most frequent values) instead of means or medians to represent the clusters.
In K-means clustering when we used categorical data after converting it into a numerical form. it doesn’t give a good result for high-dimensional data.
So, Some changes are made for categorical data t.
- Replace Euclidean distance with Dissimilarity metric
- Replace Mean by Mode for cluster centers.
- Apply a frequency-based method in each iteration to update the mode.
And then this is called K-MODE Clustering because of MODE.
Dissimilarity measurements between two data objects
K-modes is an algorithm for clustering categorical data. It is used to partition a dataset into a specified number of clusters, where each cluster is characterized by a mode, which is the most frequent categorical value in the cluster.
Similarity and dissimilarity measurements are used to determine the distance between the data objects in the dataset. In the case of K-modes, these distances are calculated using a dissimilarity measure called the Hamming distance. The Hamming distance between two data objects is the number of categorical attributes that differ between the two objects.
Let x and y be two categorical data objects defined by m features or attributes.

Where,

For example, consider the following dataset with three categorical attributes:
| S.No | Attribute 1 | Attribute 2 | Attribute 3 |
| 1 | A | B | C |
| 2 | A | B | D |
| 3 | A | C | E |
| 4 | B | C | E |
To calculate the Hamming distance between data objects 1 and 2, we compare their values for each attribute and count the number of differences. In this case, there is one difference (Attribute 3 is C for object 1 and D for object 2), so the Hamming distance between objects 1 and 2 is 1.
To calculate the Hamming distance between objects 1 and 3, we again compare their values for each attribute and count the number of differences. In this case, there are two differences (Attribute 2 is B for object 1 and C for object 3, and Attribute 3 is C for object 1 and E for object 3), so the Hamming distance between objects 1 and 3 is 2.
To calculate the Hamming distance between objects 1 and 4, we again compare their values for each attribute and count the number of differences. In this case, there are three differences (Attribute 1 is A for objects 1 and B for object 4, Attribute 2 is B for object 1 and C for object 4, and Attribute 3 is C for objects 1 and E for object 4), so the Hamming distance between objects 1 and 4 is 3.
Data objects with a smaller Hamming distance are considered more similar, while objects with a larger Hamming distance is considered more dissimilar.
How K-Modes clustering works:
Let X be a set of categorical data objects of  that can be denoted as
 ![X = [X_{1},X_{2},...,X_{n}]](https://www.geeksforgeeks.org/wp-content/ql-cache/quicklatex.com-721b156abc934eeccf3ca410de59bcf9_l3.png "Rendered by QuickLaTeX.com") . And the mode of Z is a vector
. And the mode of Z is a vector ![Q = [q_{1},q_{2},...,q_{m}]](https://www.geeksforgeeks.org/wp-content/ql-cache/quicklatex.com-61b708942854c4b694e0a044517b4254_l3.png "Rendered by QuickLaTeX.com") then, minimize
then, minimize

Apply dissimilarity metric equation for data objects

Suppose we want to K cluster, Then we have Q = [q_{k1},q_{k1},….,q_{km}] \epsilon Q

The main task for K-Modes algorithm is to minimize this C(Q) cost function.
It consists of the following steps.
- Select K data objects for each cluster.
- Calculate dissimilarities
 and allocate each data object to nearest cluster.
 - Calculate the new modes for all clusters.
- Repeat step 2 and 3 until the cluster will become stable.
Some variations of the K-modes algorithm may use different methods for updating the centroids (modes) of the clusters, such as taking the weighted mode or the median of the objects within each cluster.
Overall, the goal of K-modes clustering is to minimize the dissimilarities between the data objects and the centroids (modes) of the clusters, using a measure of categorical similarity such as the Hamming distance.
Implementation of the k-mode clustering algorithm in Python:
Python3
import numpy as np
from scipy.stats import mode
data = np.array([['A', 'B', 'C'],
['B', 'C', 'A'],
['C', 'A', 'B'],
['A', 'C', 'B'],
['A', 'A', 'B']])
k = 2
modes = [['A', 'B', 'C'],
['C', 'B', 'A']]
clusters = np.zeros(data.shape[0], dtype=int)
clusters_prev = np.zeros(data.shape[0], dtype=int)
for i in range(10):
for j, object in enumerate(data):
distances = np.array([sum(object != mode) for mode in modes])
clusters[j] = np.argmin(distances)
for j in range(k):
modes[j] = mode(data[clusters == j]).mode[0]
if (clusters == clusters_prev).all():
break
clusters_prev = clusters
print("The cluster assignments for each data object: ", clusters)
print("Modes for each cluster: ", modes)
|
Output:
The cluster assignments for each data point:  [0 1 0 0 0]
Modes for each cluster:  [array(['A', 'A', 'B'], dtype='<U1'), array(['B', 'C', 'A'], dtype='<U1')]
The above code is an implementation of the k-mode clustering algorithm, which is a clustering algorithm that can be used to group a set of data points with categorical attributes into clusters. The code uses the numpy and scipy.stats modules, which are commonly used for scientific computing in Python.
- The NumPy module provides functions for working with arrays and matrices.
- The scipy.stats module provides functions for working with statistical data, which is used to compute the modes for the clusters in the code.
- The code first defines the data set with three categorical variables and then chooses the number of clusters k that the data should be grouped into.
- It then initializes the modes for each cluster and the cluster assignments for each data point.
- The code then uses a for loop to iteratively assign data points to their clusters and update the cluster modes.
- At each iteration, the code first assigns each data point to the cluster with the most similar modes for its categorical attributes. It does this by computing the distances between the modes for each cluster and the values for the categorical attributes of the data point and then assigning the data point to the cluster with the smallest distance.
- Next, the code updates the cluster modes by computing the modes for the categorical attributes of the data points that are assigned to each cluster. It then checks if the cluster assignments have converged, and if they have, it breaks out of the for a loop. Otherwise, it stores the current cluster assignments in the clusters_prev variable and continues with the next iteration.
- Finally, the code prints the cluster assignments for each data point, and the modes for each cluster.
- This shows that the first, third, fourth, and fifth data points have been assigned to the first cluster, and the second data points have been assigned to the second cluster.
- The modes for each cluster are also printed, which are [‘A’, ‘A’, ‘B’] for the first cluster and [‘B’, ‘C’, ‘A’] for the second cluster.
Cluster with kmodes library.
Find the optimal number of clusters in the K-Mode algorithm?
Elbow method is used to find the optimal number of clusters
Python3
import pandas as pd
import numpy as np
from kmodes.kmodes import KModes
import matplotlib.pyplot as plt
%matplotlib inline
cost = []
K = range(1,5)
for k in list(K):
kmode = KModes(n_clusters=k, init = "random", n_init = 5, verbose=1)
kmode.fit_predict(data)
cost.append(kmode.cost_)
plt.plot(K, cost, 'x-')
plt.xlabel('No. of clusters')
plt.ylabel('Cost')
plt.title('Elbow Curve')
plt.show()
|
Outputs :
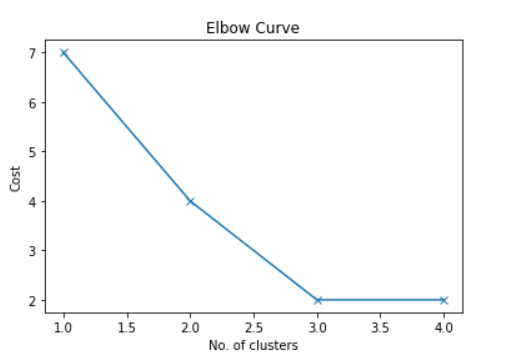
Elbow Method
As we can see from the graph there is an elbow-like shape at 2 and 3. Now it we can consider either 2 or 3 cluster. Let’s consider Number of cluster =2
Python3
kmode = KModes(n_clusters=2, init = "random", n_init = 5, verbose=1)
clusters = kmode.fit_predict(data)
clusters
|
Outputs :
array([1, 0, 1, 1, 1], dtype=uint16)
This also shows that the first, third, fourth, and fifth data points have been assigned to the first cluster, and the second data points have been assigned to the second cluster. So, our previous answer was 100 % correct.
Share your thoughts in the comments
Please Login to comment...