Clustering in R Programming
Last Updated :
08 Jun, 2023
Clustering in R Programming Language is an unsupervised learning technique in which the data set is partitioned into several groups called clusters based on their similarity. Several clusters of data are produced after the segmentation of data. All the objects in a cluster share common characteristics. During data mining and analysis, clustering is used to find similar datasets.
Types of Clustering in R Programming
In R, there are numerous clustering algorithms to choose from. Here are a few of the most popular clustering techniques in R:
- K-means clustering: it is a data-partitioning technique that seeks to assign each observation to the cluster with the closest mean after dividing the data into k clusters.
- Hierarchical clustering: By repeatedly splitting or merging clusters according to their similarity, hierarchical clustering is a technique for creating a hierarchy of clusters.
- DBSCAN clustering: it is a density-based technique that divides regions with lower densities and clusters together data points that are close to one another.
- Spectral clustering: Spectral clustering is a technique that turns the clustering problem into a graph partitioning problem by using the eigenvectors of the similarity matrix.
- Fuzzy clustering: Instead of allocating each data point to a single cluster, fuzzy clustering allows points to belong to numerous clusters with varying degrees of membership.
- Density-based clustering: A class of techniques known as density-based clustering groups together data points based on density rather than distance.
- Ensemble clustering: Ensemble clustering is a technique for enhancing clustering performance by combining several clustering methods or iterations of the same algorithm.
Each kind of clustering technique has its own advantages and disadvantages and is appropriate for various kinds of data and clustering issues. The qualities of the data and the objectives of the research will determine which clustering technique is best.
Applications of Clustering in R Programming Language
- Marketing: In R programming, clustering is helpful for the marketing field. It helps in finding the market pattern and thus, helps in finding the likely buyers. Getting the interests of customers using clustering and showing the same product of their interest can increase the chance of buying the product.
- Medical Science: In the medical field, there is a new invention of medicines and treatments on a daily basis. Sometimes, new species are also found by researchers and scientists. Their category can be easily found by using the clustering algorithm based on their similarities.
- Games: A clustering algorithm can also be used to show the games to the user based on his interests.
- Internet: An user browses a lot of websites based on his interest. Browsing history can be aggregated to perform clustering on it and based on clustering results, the profile of the user is generated.
Methods of Clustering
There are 2 types of clustering in R programming:
- Hard clustering: In this type of clustering, the data point either belongs to the cluster totally or not and the data point is assigned to one cluster only. The algorithm used for hard clustering is k-means clustering.
- Soft clustering: In soft clustering, the probability or likelihood of a data point is assigned in the clusters rather than putting each data point in a cluster. Each data point exists in all the clusters with some probability. The algorithm used for soft clustering is the fuzzy clustering method or soft k-means.
K-Means Clustering in R Programming language
K-Means is an iterative hard clustering technique that uses an unsupervised learning algorithm. In this, total numbers of clusters are pre-defined by the user and based on the similarity of each data point, the data points are clustered. This algorithm also finds out the centroid of the cluster.
Algorithm:
- Specify number of clusters (K): Let us take an example of k =2 and 5 data points.
- Randomly assign each data point to a cluster: In the below example, the red and green color shows 2 clusters with their respective random data points assigned to them.
- Calculate cluster centroids: The cross mark represents the centroid of the corresponding cluster.
- Re-allocate each data point to their nearest cluster centroid: Green data point is assigned to the red cluster as it is near to the centroid of red cluster.
- Re-figure cluster centroid
Syntax: kmeans(x, centers, nstart)
where,
- x represents numeric matrix or data frame object
- centers represents the K value or distinct cluster centers
- nstart represents number of random sets to be chosen
Example:
R
install.packages("factoextra")
library(factoextra)
df <- mtcars
df <- na.omit(df)
df <- scale(df)
png(file = "KMeansExample.png")
km <- kmeans(df, centers = 4, nstart = 25)
fviz_cluster(km, data = df)
dev.off()
png(file = "KMeansExample2.png")
km <- kmeans(df, centers = 5, nstart = 25)
fviz_cluster(km, data = df)
dev.off()
|
Output:
When k = 4
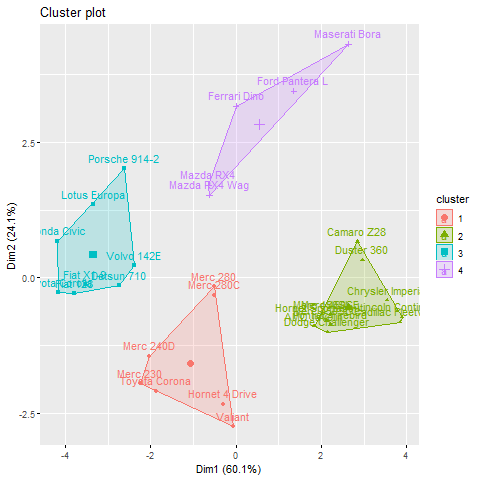
K-Means Clustering in R Programming
When k = 5
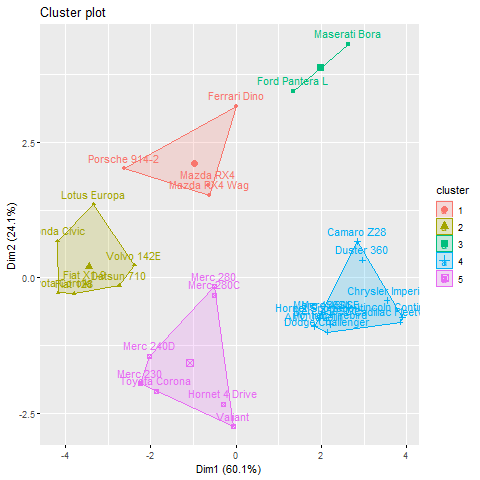
K-Means clustering in R
Using the fviz_cluster function from the factoextra package, this code applies k-means clustering to the mtcars dataset using two different values of centers (4 and 5) and then saves the cluster visualizations as PNG files.
The clustering technique uses the information from the mtcars dataset, which includes details on various automobile models including the number of cylinders, horsepower, and miles per gallon. The scale function is used to scale the data to have a zero mean and unit variance, and the na.omit function is used to delete any rows with missing values.
Then, to improve the chance of discovering the global optimum, the means function is used to execute k-means clustering with 4 and 5 clusters. The fviz_cluster function, which plots the data points coloured by cluster membership and also displays the cluster centers, is then used to see the resulting cluster assignments.
The png and dev. off functions are then used to save the generated plots as PNG files.
To save the files to the correct location on your computer, you might need to modify the file paths or file names used in the png function.
Clustering by Similarity Aggregation
Clustering by similarity aggregation is also known as relational clustering or Condorcet method which compares each data point with all other data points in pairs. For a pair of values A and B, these values are assigned to both the vectors m(A, B) and d(A, B). A and B are the same in m(A, B) but different in d(A, B).


where, S is the cluster
With the first condition, the cluster is constructed and with the next condition, the global Condorcet criterion is calculated. It follows in an iterative manner until specified iterations are not completed or the global Condorcet criterion produces no improvement.
Share your thoughts in the comments
Please Login to comment...