Fuzzy C-means Clustering in MATLAB
Last Updated :
31 Jan, 2023
Fuzzy C-means (FCM) is a method of clustering that allows points to be more than one cluster. The (FCM) is a kind of data clustering technique in which the data set is grouped into N numbers of clusters with every data point corresponding to each cluster on the basis. which is to differentiate the distance between the cluster center and the data point.
The FCM function performs Fuzzy C-means clustering, and fuzzy C-means clustering is soft skills clustering technique in Machine Learning.
Clustering
Clustering is a process of grouping the objects(data) having higher measure similarities than the object(data) in any other cluster which full fills the requirement of our criteria. it has been done by the Clustering Algorithms, various similarity measures can be used, including Euclidean, probabilistic, cosine distance, and correlation.
Dataset
The Dataset is a kind of group or storage location where we can hold(contain) the require the structured collection of information data, which is having some numeric values. And a Database has the functionality to store multiple datasets.
Note: Here we use the Iris dataset
      for Fuzzy C-means Clustering in MATLAB.
Syntax
[centers, U] = fcm(data Nc)
% perform the fcm function clustering on data and return Nc cluster center.
[centers, U] = fcm(data Nc,options)
% option means using specific additional clustering options.
[centers, U, objFunc] = fcm( __ )
% Return objective function value and optimise iteration for above syntax.
Algorithm of FCM Clustering
So first Let the set of data points X= { x1, x2, x3, —–, xn } and the set of clusters centers V= { v1, v2, v3,——, vc } .
- So first we will select the random c cluster center from the set of clusters center.
- And then find the fuzzy membership using the given formula –

Here ‘m’ is the fuzziness index, which lies between [1, ∞ ], and ‘n’ is a number of data points.
- Computing the fuzzy centers Vj using the formula.

- Optimize the Vj and fuzzy membership until the minimum j value is achieved.

In the above iteration –
K is iteration step.
β is termination value lies between [0,1]
J is the objective function.
U=(µij)n*c  is fuzzy membership matrix.
Steps for Fuzzy C-means Clustering
Step 1: First we create the MATLAB file in an editor and take the simple data sets and select the data set to N number cluster. So you have to make sure that whatever data set we will use here that data set should be inside MATLAB.
Example:
Matlab
numClusters = 3;
fuzziness = 2;
X = rand(100, 2);
[cluster_idx, cluster_center] = fcm(X, numClusters, [2, 100, 1e-5, 0]);
figure;
[c, h] = contourf(cluster_idx);
colorbar;
hold on;
plot(X(:,1), X(:,2), 'ko');
title('Fuzzy C-Means Clustering Results');
xlabel('x');
ylabel('y');
hold off;
|
- n_clusters is the length of the cluster like how many numbers of clusters we taking.
- colorbar – it’s used to displays a vertical colorbar to the right of the current axes in figure. and it mapping the data values.
- [center,U,obj_fcn]=fcm(__) it’s one of the syntaxes of the FCM function which returns the center, U matrix, and objective function value.
- Save (filename) saves all the variables from the current workshop.
- Plot() is used to create a graphical representation of some data.
Output:
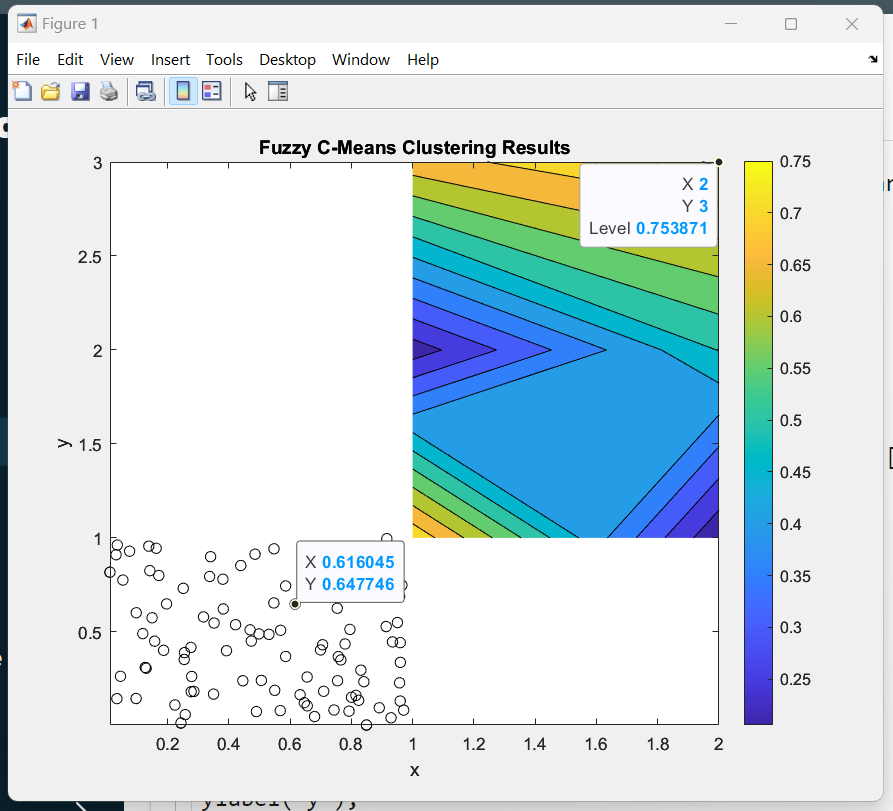
FCM Result
Explanation-
The fcm function performs Fuzzy C-means Clustering on the input data X, with numClusters clusters and fuzziness parameter. The output, cluster_idx, is a matrix of the same size as X, where each element represents the cluster index of the corresponding element in X. The cluster_center is a matrix where each row contains the cluster center of each cluster.
The contourf function is used to plot the clustering results by showing the cluster index of each data point. The plot function is used to plot the data points on top of the contour plot.
It is important to note that the input data X must be a matrix where each row represents a data point and each column represents a feature, and the number of clusters should be defined according to the data set and the problem to solve.
The Fuzzy C-means Clustering Algorithm gives the best result for manipulated, overlapped data set, and FCM is better than K-means clustering.
Share your thoughts in the comments
Please Login to comment...