How to create a function in MATLAB ?
Last Updated :
26 May, 2021
A function is a block of statements that intend to perform a specific task. Functions allow the users to reuse the code frequently. MATLAB has several predefined functions which are ready to use such as sin(), fact(), cos() etc. MATLAB also allows the users to define their own functions.
Syntax:
function output_params = function_name(iput_params)
% Statements
end
- The function starts with the keyword function.
- Returning variables of the function are defined in output_params
- function_name specifies the name of the function
- input_params are input arguments to the function
Below are some examples that depict how to use functions in MATLAB:
Example 1: Function with one output
The function calculates the mean of the input vector
Matlab
values = [12, 4, 8.9, 6, 3];
function m = stat(x)
n = length(x);
m = sum(x)/n;
end
mean = stat(values)
|
Output :
mean = 6.7800
Example 2: Function with multiple outputs
The function calculates both nCr and nPr of inputs n and r.
Matlab
x = 3;
y = 2;
function [p,c] = perm(n,r)
p = factorial(n)/factorial(n-r);
c = p*factorial(r);
end
[p,c] = perm(x,y)
|
Output :
p = 6
c = 12
Example 3: Multiple functions in a file
- stat2() function calculates the standard deviation of the input vector.
- stat1() calculates the mean of the input vector.
Matlab
values = [12, 4, 8.9, 6, 3];
function sd = stat2(x)
m = stat1(x);
n = length(x)
sd = sqrt(sum((x-m).^2/n));
end
function m = stat1(x)
n = length(x);
m = sum(x)/n;
end
stat2(values)
|
Output :
n = 5
ans = 3.2975
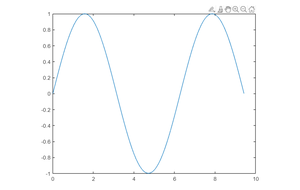
Example 4: Function with no input_params
In this program, we will create the sin_plot() function that plots the sin() function
Matlab
function sin_plot()
x = linspace(0,2*pi,100);
y = sin(x);
plot(x,y);
end
sin_plot()
|
Output :
Like Article
Suggest improvement
Share your thoughts in the comments
Please Login to comment...