What is Statistics? Statistics is the study of data collection, analysis, perception, introduction, and organization. It is a method of gathering and summarizing results. Statistics is the branch of mathematics that is all about the gathering, observing, interpretation, presentation, and organization of data. In simpler words, it is a field to collect and summarize data. There are two important principles involved in statistics they are, uncertainty and variation. These two factors can be calculated only through statistical analysis. This uncertainty in events is determined with the help of probability which plays an important role in the field of statistics.
Statistics has a wide range of applications in many disciplines, including economics, psychology, geology, weather forecasts, and so on. The information gathered for research here may be quantitative or qualitative. Quantitative data can also be divided into two types: discrete and continuous. Continuous data has a spectrum rather than a single value, whereas discrete data has a fixed value.
What is Statistics?
Statistics is defined as the study and manipulation of data. As we have already discussed in the introduction statistics deals with the analysis of numerical data. It is used to derive conclusions from data that is collected and analyzed. Let’s discuss a few more definitions here,
According to the Merriam-Webster dictionary, statistics is defined as “classified facts representing the conditions of a people in a state – especially the facts that can be stated in numbers or any other tabular or classified arrangement”.
According to statistician Sir Arthur Lyon Bowley, statistics is defined as “Numerical statements of facts in any department of inquiry placed in relation to each other”.
Examples of Statistics
- Suppose there are 20 students in a class and you have to calculate what is the average height in the class of 20 students. So here the average or the mean value is the statistics of the height obtained.
- Suppose you need to calculate what is the literacy rate of a city that has a population of 2 lakh people, hence we will take a survey of 2000 people (sample) and based on that data which is the statistic, we will find out the rate.
- Statistics is used in various day-to-day applications like weather forecasting, stock market trend prediction, traffic light optimization, investing, etc.
Basics of Statistics
The basics of statistics comprise of :
- Measure of Central tendency(Mean, Median, Mode)
- Measure of Dispersion(Variance and Standard Deviation)
Mean is the average of the observations. Median is the middle or the central value of the observations when arranged in order. The mode is the most frequently occurring observation in the data set.
Variance is defined as the measure of how far a set of data are dispersed from its mean value and is calculated by the average of the squared differences from the mean. Standard Deviation is the square root of variance.
What is Mathematical Statistics?
The application of mathematical concepts like linear algebra, differential equations, mathematical analysis, and probability theories in statistics is known as mathematical statistics.
In simpler words, it is the application of Mathematics to Statistics.
Types of Statistics
There are two types of Statistics:
- Descriptive Statistics: The data is summarized and interpreted and explained in this type of statistics. The data is summarized from a population sample using factors such as mean and standard deviation. It is a way of organizing, presenting, and explaining a set of data using graphs and summary measures. To summarise data and show it in tables or graphs, typical methods include histograms, pie charts, bars, and scatter plots. Simply put, descriptive statistics are that. Beyond the data they gather, they don’t need to be normalized.
- Inferential Statistics: We try to understand the meaning of descriptive statistics using inferential statistics. After the data has been gathered, assessed, and summarised, we use inferential statistics to explain what the data mean. Inferential statistics uses the probability principle to examine if patterns seen in a research sample may be extrapolated to the larger population from which the sample was taken. Inferential statistics may be used to forecast population numbers in addition to testing hypotheses and examining connections between variables. To draw conclusions and inferences from samples, or to make precise generalizations, inferential statistics is used.
The formulas that are used in statistical analysis are given below :
| Sample Mean,[Tex]\overline{x}
[/Tex] | ∑x/n |
| Population Mean,μ | ∑x/N |
| Sample Standard Deviation,(s) | [Tex]\\\sqrt\frac{{\sum(x-\overline{x})^2}}{n-1}
[/Tex] |
| Population Standard Deviation,σ | [Tex]\\\sqrt\frac{{(x-μ)^2}}{N}
[/Tex] |
| Sample variance,s2 | [Tex]\\\frac{{\sum(x_{i}-\overline{x})^2}}{n-1}
[/Tex] |
| Population Variance,σ2 | [Tex]\\\frac{{\sum(x_{i}-μ)^2}}{N}
[/Tex] |
| Range,(R) | Largest data value- smallest data value |
Summary Statistics
Summary statistics in statistics are a subset of descriptive statistics, which is one of the statistical types and provides a list of details regarding sample data. We know that statistics deals with the quantitative and visual display of data. So, summarising statistical data is what summary statistics do. In general, summary statistics are concerned with simplifying the data so that the observer can quickly grasp it. Statisticians typically try to explain the observations by determining:
- The average or measure of central tendency for the data, such as the arithmetic mean.
- The measurement of distributional characteristics such as skewness or kurtosis.
- The measure of dispersion such as Standard mean absolute deviation.
- The measure of statistical dependency such as the correlation coefficient.
Summary Statistics Table
It is the visual representation of statistical information that is summarized in tabular form.
For instance, the favorite fruit of 25 people is mango, orange, mango, mango, apple, apple, guava, guava, strawberry, mango, apple, grapes, orange, apple, mango, strawberry, guava, orange, mango, apple, guava, guava, grapes, grapes, mango.
| Fruit | No. of Students |
|---|
| Mango | 7 |
| Apple | 5 |
| Strawberry | 2 |
| Orange | 3 |
| Guava | 5 |
| Grapes | 3 |
| Total | 25 |
Thus, the summary statistics table tells us that 7 students have their favorite fruit as mango, 5 students have apple as their favorite people, 2 students have strawberry as their favorite fruit, 3 students have orange as their favorite fruit, 5 students have guava as their favorite fruit,3 students have grapes as their favorite fruit. Summary Statistics is used to interpret big data and predict accurate results.
Scope of Statistics
Numerous fields, including psychology, geology, sociology, forecasting the weather, probability, and many more, use statistics. Statistics is considered a mathematical science since its concentration is on applications and its purpose is to get insight from the data.
Methods in Statistics
The techniques include gathering, condensing, examining, and understanding fluctuating numerical data. Here, a few of the techniques are listed below.
- Data gathering
- Summarising data
- Statistic evaluation
What is Data in Statistics?
Data is a collection of observations, it can be in the form of numbers, words, measurements, or statements.
Types of Data
- Qualitative Data: This data is descriptive. For example – She is beautiful, He is tall, etc.
- Quantitative Data: This is numerical information. For example- A horse has four legs.
Types of Quantitative Data
- Discrete Data: It has a particular fixed value and can be counted.
- Continuous Data: It is not fixed but has a range of data and can be measured.
Statistical Data
When complete census data cannot be obtained, statisticians gather sample data through the creation of complex experiment designs and survey samples. Statistics, in and of itself, offers tools for prediction and forecasting via statistical models. The scientific discipline of probability theory includes sampling theory. In mathematical statistics, probability is used to investigate the sampling distributions of sample statistics and, more broadly, the properties of statistical procedures like organizing and grouping data through graphs, pie charts, etc as discussed in the articles below:
- Data Handling
- Organizing Data
- Grouping Data
- Pie Chart
- Chance and Probability
- Introduction to Graphs
- Linear Graphs
- Presentation of data
- Graphical Representation of Data
- Bar graphs and Histograms
Representation of data
Data may be represented in various ways, including tables, charts, and graphs. In general, statistical data are represented as follows:
- Bar Graph
- Pie Chart
- Line Graph
- Pictograph
- Histogram
- Frequency Distribution
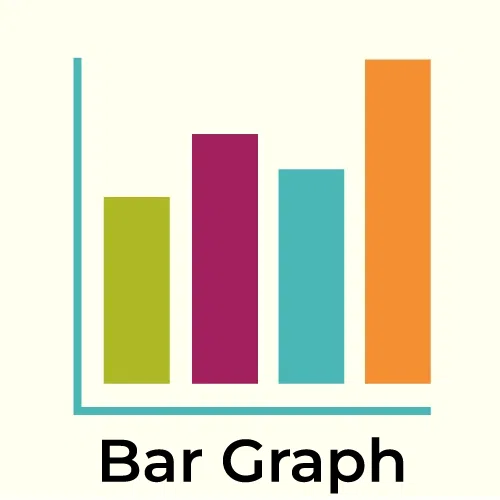 | In a bar graph, rectangular bars with lengths corresponding to the values they indicate are used to demonstrate data groups. Both a vertical and a horizontal bar plot are possible. |
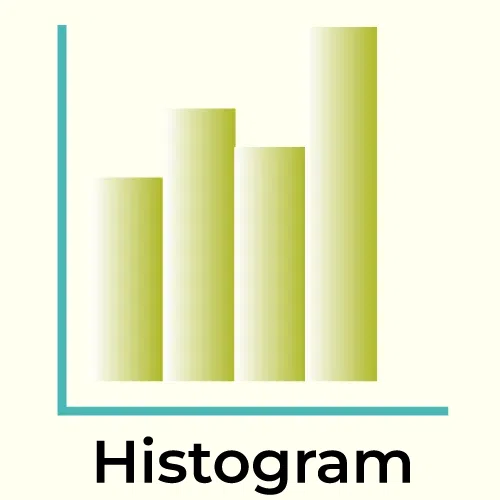 | The histogram is a type of graph where the diagram consists of rectangles, the area is proportional to the frequency of a variable and the width is equal to the class interval. |
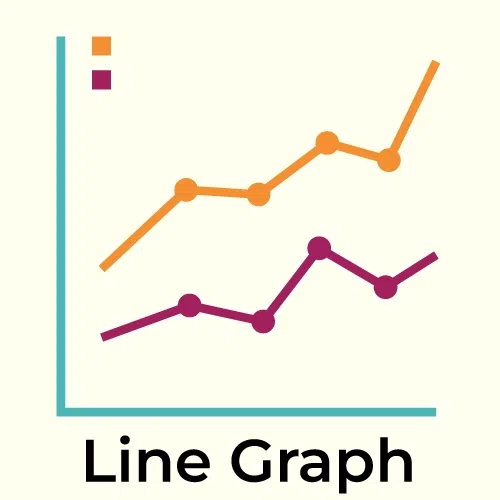 | The line chart is represented by a series of data points connected with a straight line. |
 | A pie chart is a form of graph where a circle is divided into sectors, each of which represents a percentage of the entire. |
 | In a pictograph, information is displayed as images. Different numbers can be used to represent various pictorial symbols for words, objects, and phrases.
|
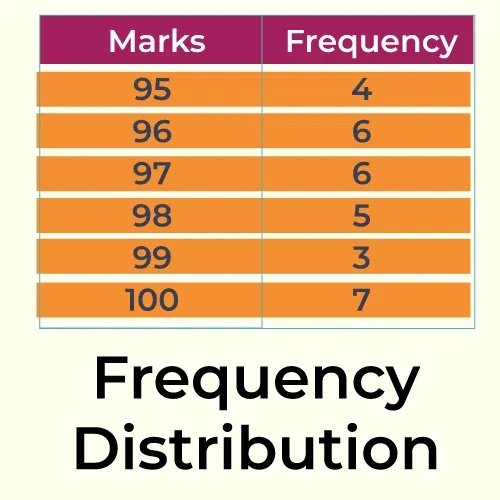 | Statistics display the data in ascending order together with their accompanying frequencies in a frequency distribution table.
f is a common way to indicate the data’s frequency. |
Statistical Methods
Any statistical method is accurate whether the structure or population under consideration meets the method’s assumptions. The fundamental distinction between classical probability theory and sampling theory is that probability theory begins with the given parameters of a total population and deduces probabilities that apply to samples. Statistical inference, on the other hand, proceeds in the other way, inferring from samples to the parameters of a greater or entire population. Let’s discuss the statistical methods as:
- Central Tendency
- Mean, Median, Mode, and Range
- Step Deviation Method for Finding the Mean with Examples
- Mean, Median, and Mode of grouped data
- Cumulative Frequency Curve
- Measures of Spread
- Mean Absolute Deviation
- Measures of Central Tendency
- Difference Between Mean, Median, and Mode with Examples
- Analysis of Frequency Distribution
- Variance and Standard Deviation
Measures of Central Tendency
Statistics are employed in mathematics to explain the central patterns of both grouped and ungrouped data. The three central tendency measurements are:
The central value of the data set is determined using each of the three measures of central tendency
Measures of Dispersion
In statistics, the dispersion measures help in understanding how homogeneous or heterogeneous the data is. In simpler words, it shows how constrained or dispersed the variable is. Absolute and relative dispersion metrics are the two different categories that exist. They are as follows:
Skewness in Statistics
In statistics, skewness is a metric for a probability distribution’s asymmetry. For specific data collection, it calculates the deviation from the normal distribution curve.
Skewed distribution values might be positive, negative, or zero. The normal distribution’s bell curve often has zero skewness.
ANOVA Statistics
Analysis of Variance, or ANOVA, is a group of statistical models that are employed to calculate the mean difference for the specified set of data.
Degree of Freedom
The degree of freedom is employed in statistical analysis for the values that are subject to change. The degree of information freedom refers to the amount of independent data or information that may be changed when estimating a parameter.
Regression Analysis
In this model, the link between the variables is established using statistical analysis. The process represents how a dependent variable changes as a result of an altered independent variable.
Applications of Statistics
Numerous areas of mathematics, as well as daily life, use statistics extensively. Following are a few examples of statistics applications
- Applied statistics, theoretical statistics, and mathematical statistics
- Machine learning and data mining
- Statistics in society
- Statistical computing
- Statistics applied to the Mathematics of the Arts
Also Check:
Statistics – FAQs
What is Statistics in general?
Statistics is the branch of mathematics that is all about the gathering, observing, interpretation, presentation, and organization of data. In simpler words, it is a field to collect and summarize data.
What are two types of Statistics?
These are the two various categories of statistics:
Descriptive Statistics:Using the mean and standard deviation, it is used to summarise the data and its characteristics.
Inferential Statistics:It is employed to draw a conclusion from the information gathered.
How many types of Measures of Central Tendency exist?
The three central tendency measurements are:
What are real-life examples of Statistics?
There are various applications of Statistics in real life such as weather forecasting, sales tracking, health insurance, traffic analysis, investing etc.
How is Statistics used in Mathematics?
Probability theory is used in statistics, a branch of applied mathematics, to streamline the sample data we get. It is useful to describe the chance that data generalisations are true. Statistical inference is the term used for this.
What is the Importance of Statistics in Real Life?
Statistics helps to gather the information, analysis of the information, and successfully presenting the outcomes.
What are the 3 types of statistic?
Statistics involves methods like Mean, Median, and Mode to analyze data through processes of Collection, Analysis, Interpretation, and Presentation.
What is scope of statistics?
Statistics is the field focusing on interpreting, analyzing, organizing, and presenting data. Its applications span various fields, including solving social, industrial, and scientific issues.
What are the Common concepts in statistics?
- Population
- Sample and parameter
- Measures of central tendency
- Variance, covariance, and standard deviation
- Regression
- Skewness
- ANOVA
Share your thoughts in the comments
Please Login to comment...