Mean, Median, and Mode are measures of the central tendency. These values are used to define the various parameters of the given data set. The measure of central tendency (Mean, Median, and Mode) gives useful insights about the data studied, these are used to study any type of data such as the average salary of employees in an organization, the median age of any class, the number of people who plays cricket in a sports club, etc.
Let’s learn more about the Mean, Median, and Mode Formulas, Examples, and FAQs in this article.
Measures of Central Tendency
Measure of central tendency is the representation of various values of the given data set. There are various measures of central tendency and the most important three measures of central tendency are:
- Mean (x̅ or μ): The mean, or arithmetic average, is calculated by summing all the values in a dataset and dividing by the total number of values. It’s sensitive to outliers and is commonly used when the data is symmetrically distributed.
- Median (M): The median is the middle value when the dataset is arranged in ascending or descending order. If there’s an even number of values, it’s the average of the two middle values. The median is robust to outliers and is often used when the data is skewed.
- Mode (Z): The mode is the value that occurs most frequently in the dataset. Unlike the mean and median, the mode can be applied to both numerical and categorical data. It’s useful for identifying the most common value in a dataset.
What is Mean?
Mean is the sum of all the values in the data set divided by the number of values in the data set. It is also called the Arithmetic Average. Mean is denoted as x̅ and is read as x bar.
The formula to calculate the mean is:
.png)
Formula of Mean
Symbol of Mean
The symbol used to represent the mean, or arithmetic average, of a dataset is typically the Greek letter “μ” (mu) when referring to the population mean, and “x̄” (x-bar) when referring to the sample mean.
- Population Mean: μ (mu)
- Sample Mean: x̄ (x-bar)
These symbols are commonly used in statistical notation to represent the average value of a set of data points.
The formula to calculate the mean is:
Mean (x̅) = Sum of Values / Number of Values
If x1, x2, x3,……, xn are the values of a data set then the mean is calculated as:
x̅ = (x1 + x2 + x3 + . . . + xn) / n
Example: Find the mean of data sets 10, 30, 40, 20, and 50.
Solution:
Mean of the data 10, 30, 40, 20, 50 is
Mean = (sum of all values) / (number of values)
Mean = (10 + 30 + 40 + 20+ 50) / 5 = 30
Mean of Grouped Data
Mean for the grouped data can be calculated by using various methods. The most common methods used are discussed in the table below:
| Direct Method |
Assumed Mean Method |
Step Deviation Method |
|
x̅ = ∑ fixi / ∑ fi
Where,
∑fi is the sum of all frequencies
|
x̅ = a + ∑ fixi / ∑ fi
Where,
a is Assumed mean
di is equal to xi – a
∑fi the sum of all frequencies
|
x̅ = a + h∑ fixi / ∑ fi
Where,
a is Assumed mean
ui = (xi – a)/h
h is Class size
∑fi the sum of all frequencies
|
Read More about Mean, Median and Mode of Grouped Data.
A Median is a middle value for sorted data. The sorting of the data can be done either in ascending order or descending order. A median divides the data into two equal halves.
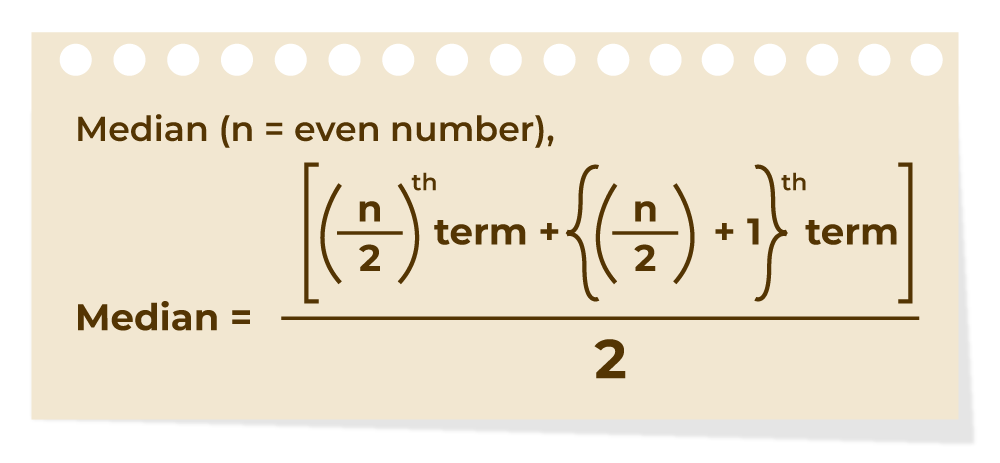
The formula to calculate the median of the number of terms if the number of terms is even is shown in the image below:
Median Formula for Even Terms
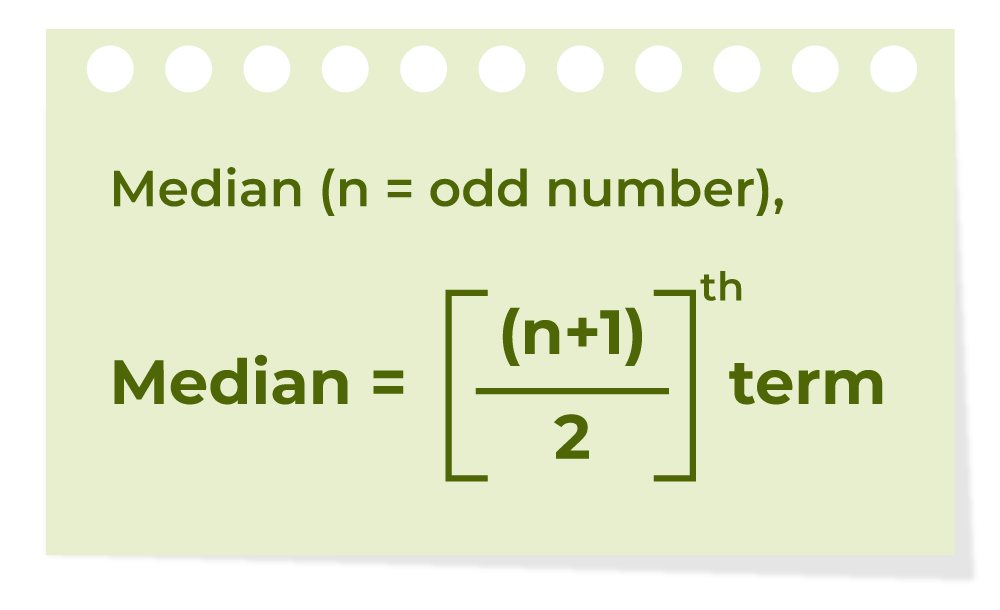
The formula to calculate the median of the number of terms if the number of terms is odd is shown in the image below:
Median Formula for Odd Terms
Symbol of Median
The letter “M” is commonly used to represent the median of a dataset, whether it’s for a population or a sample. This notation simplifies the representation of statistical concepts and calculations, making it easier to understand and apply in various contexts. Therefore, in Indian statistical practice, “M” is widely accepted and understood as the symbol for the median.
The formula for the median is:
If the number of values (n value) in the data set is odd then the formula to calculate the median is:
Median = [(n + 1)/2]th term
If the number of values (n value) in the data set is even then the formula to calculate the median is:
Median = [(n/2)th term + {(n/2) + 1}th term] / 2
Example: Find the median of given data set 30, 40, 10, 20, and 50.
Solution:
Median of the data 30, 40, 10, 20, 50 is,
Step 1: Order the given data in ascending order as:
10, 20, 30, 40, 50
Step 2: Check n (number of terms of data set) is even or odd and find the median of the data with respective ‘n’ value.
Step 3: Here, n = 5 (odd)
Median = [(n + 1)/2]th term
Median = [(5 + 1)/2]th term
= 30
Median of Grouped Data
The median of the grouped data median is calculated using the formula,
Median = l + [(n/2 – cf) / f]×h
where
l is lower limit of median class
n is number of observations
f is frequency of median class
h is class size
cf is cumulative frequency of class preceding the median class.
Read More about Median of Grouped Data.
What is Mode?
A mode is the most frequent value or item of the data set. A data set can generally have one or more than one mode value. If the data set has one mode then it is called “Uni-modal”. Similarly, If the data set contains 2 modes then it is called “Bimodal” and if the data set contains 3 modes then it is known as “Trimodal”. If the data set consists of more than one mode then it is known as “multi-modal”(can be bimodal or trimodal). There is no mode for a data set if every number appears only once.
The formula to calculate the mode is shown in the image below:
.png)
Formula of Median
Symbol of Mode
In statistical notation, the symbol “Z” is commonly used to represent the mode of a dataset. It indicates the value or values that occur most frequently within the dataset. This symbol is widely utilised in statistical discourse to signify the mode, enhancing clarity and precision in statistical discussions and analyses.
Mode Formula
Mode = Highest Frequency Term
Example: Find the mode of the given data set 1, 2, 2, 2, 3, 3, 4, 5.
Solution:
Given set is {1, 2, 2, 2, 3, 3, 4, 5}
As the above data set is arranged in ascending order.
By observing the above data set we can say that,
Mode = 2
As, it has highest frequency (3)
Mode of Grouped Data
The mode of the grouped data is calculated using the formula:
Mode = l + [(f1 + f0) / (2f1 – f0 – f2)] × h
Where,
- f1 is the frequency of the modal class,
- f0 is the frequency of the class preceding the modal class,
- f2 is the frequency of the class succeeding the modal class,
- h is the size of class intervals, and
- l is the lower limit of modal class.
Read More about Mode of Grouped Data.
For any group of data, the relation between the three central tendencies mean, median, and mode is shown in the image below:
Mode = 3 Median – 2 Mean
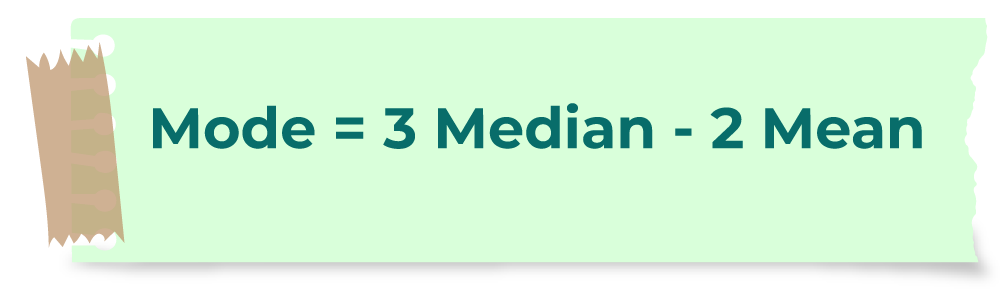
Mode = 3 Median – 2 Mean
Mean, Median and Mode- Another name for this relationship is an empirical relationship. When we know the other two measures for a given set of data, this is used to find one of the measures. The LHS and RHS can be switched to rewrite this relationship in various ways.
Range of Data
Range is the difference between the highest value and the lowest value. It is a way to understand how the numbers are spread in a data set. The range of any data set is easily calculated by using the formula given in the image below:
.png)
Formula to Find Range
Range Formula
The formula to find the Range is:
Range = Highest value – Lowest Value
Example: Find the range of the given data set 12, 19, 6, 2, 15, 4.
Solution:
Given set is {12, 19, 6, 2, 15, 4}
Here,
Lowest Value = 2
Highest Value = 19
Range = 19 − 2 = 17
The key differences between mean and median are listed in the following table:
| Aspect |
Mean |
Median |
| Definition |
The sum of all values divided by the count |
The middle value of a sorted dataset |
| Calculation |
Mean = Sum of all values/Count |
Median is the middle value when the data is arranged in ascending or descending order |
| Sensitivity to Outliers |
Can be highly influenced by extreme values in the dataset |
Less sensitive to extreme values, outliers have minimal impact |
| Use Cases |
Commonly used in statistical analysis and mathematics |
Useful when extreme values skew the data or when the distribution is not symmetric |
Let’s see the following example to understand the difference.
The difference between Mean and Median is understood by the following example. In a school, there are 8 teachers whose salaries are 20000 rupees, a principal with a salary of 35000, find their mean salary and median salary.
Mean = (20000+20000+20000+20000+20000+20000+20000+20000+35000)/9 = 195000/9 = 21666.67
Therefore, the mean salary is ₹21,666.67.
For median, in ascending order: 20000, 20000, 20000, 20000, 20000, 20000, 20000, 20000, 35000.
n = 9,
Thus, (9 + 1)/2 = 5
Thus, the median is the 5th observation.
Median = 20000
Therefore, the median is ₹20,000.
Note: Mean gets easily affected by extreme values.
Mean, median, and mode are measures of central tendency in statistics.
|
Feature
|
Mean
|
Median
|
Mode
|
|
Definition
|
Mean is the average of all values.
|
Median is the middle value when data is sorted.
|
Mode is the most frequently occurring value in the dataset.
|
|
Sensitivity
|
Mean is sensitive to outliers.
|
Median is not sensitive to outliers .
|
Mode is not sensitive to outliers.
|
|
Calculation
|
Calculated by adding up all values of a dataset and dividing them by the total number of values in dataset.
|
Calculated by finding the middle value in a list of data.
|
Calculated by finding which value occurs more number of times in a dataset.
|
|
Representation
|
The value of mean may or may not be in dataset.
|
The value of median is always a value from the dataset.
|
The value of mode is also always a value from the dataset.
|
Difference Between Mean and Average
| Aspect |
Mean |
Average |
| Definition |
The sum of all values divided by the count |
The sum of all values divided by the count |
| Formula |
x̄=∑ x/n |
Same as the mean formula |
| Importance |
Commonly used in statistics and mathematics |
Often used interchangeably with “mean.” |
| Sensitivity |
Affected by outliers |
Can be less sensitive to outliers. |
| Application |
Used for analyzing data sets |
Commonly used in everyday language and contexts. |
| Representation |
Usually represented symbolically as μ |
Often referred to simply as “average” or “avg.” |
| Context |
Often used in research and analysis |
Informally used in everyday conversation. |
The terms “mean” and “average” are frequently used in mathematics and statistics, often interchangeably. However, they possess subtle distinctions in their meanings and applications.
Mean, in statistical terms, represents the arithmetic average of a dataset. It is calculated by summing up all the values in the dataset and dividing the sum by the total number of values. For instance, if you have the numbers 2, 4, 6, 8, and 10, the mean would be (2 + 4 + 6 + 8 + 10) / 5 = 6.
On the other hand, “Average” is a broader term that can refer to various measures of central tendency, including mean, median, and mode. In common usage, however, “average” often specifically denotes the mean. Like the mean, it involves summing up a set of values and dividing by the number of values to obtain a representative value.
Read More about Difference between Mean and Average.
Mean, Median and Mode are the measure of central tendency which helps us analyze and interpret data across various fields. Mean, often used as the arithmetic average, is sensitive to extreme values. On the other hand, the median, representing the middle value of any dataset. Meanwhile, the mode, indicating the most frequently occurring value.
Question 1: Study the bar graph given below and find the mean, median, and mode of the given data set.
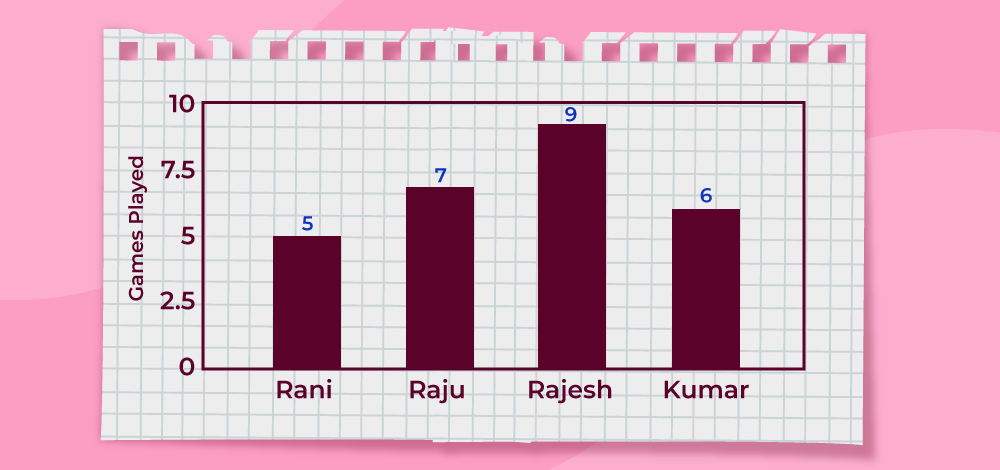
Solution:
Mean = (sum of all data values) / (number of values)
Mean = (5 + 7 + 9 + 6) / 4
= 27 / 2
= 6.75
Order the given data in ascending order as: 5, 6, 7, 9
Here, n = 4 (which is even)
Median = [(n/2)th term + {(n/2) + 1}th term] / 2
Median = (6 + 7) / 2
= 6.5
Mode = Most frequent value
= 9 (highest value)
Range = Highest value – Lowest value
Range = 9 – 5
= 4
Question 2: Find the mean, median, mode, and range for the given data
190, 153, 168, 179, 194, 153, 165, 187, 190, 170, 165, 189, 185, 153, 147, 161, 127, 180
Solution:
For Mean:
190, 153, 168, 179, 194, 153, 165, 187, 190, 170, 165, 189, 185, 153, 147, 161, 127, 180
Number of observations = 18
Mean = (Sum of observations) / (Number of observations)
= (190+153+168+179+194+153+165+187+190+170+165+189+185+153+147 +161+127+180) / 18
= 2871/18
= 159.5
Therefore, the mean is 159.5
For Median:
The ascending order of given observations is,
127, 147, 153, 153, 153, 161, 165, 165, 168, 170, 179, 180, 185, 187, 189, 190, 190, 194
Here, n = 18
Median = 1/2 [(n/2) + (n/2 + 1)]th observation
= 1/2 [9 + 10]th observation
= 1/2 (168 + 170)
= 338/2
= 169
Thus, the median is 169
For Mode:
The number with the highest frequency = 153
Thus, mode = 53
For Range:
Range = Highest value – Lowest value
= 194 – 127
= 67
Question 3: Find the Median of the data 25, 12, 5, 24, 15, 22, 23, 25
Solution:
25, 12, 5, 24, 15, 22, 23, 25
Step 1: Order the given data in ascending order as:
5, 12, 15, 22, 23, 24, 25, 25
Step 2: Check n (number of terms of data set) is even or odd and find the median of the data with respective ‘n’ value.
Step 3: Here, n = 8 (even) then,
Median = [(n/2)th term + {(n/2) + 1)th term] / 2
Median = [(8/2)th term + {(8/2) + 1}th term] / 2
= (22+23) / 2
= 22.5
Question 4: Find the mode of given data 15, 42, 65, 65, 95.
Solution:
Given data set 15, 42, 65, 65, 95
The number with highest frequency = 65
Mode = 65
What are the mean, median, and mode?
Mean, Median and Mode are the measures of central tendency. These three measures of central tendency are used to get an overview of the data. They represent the true essence of the given data set.
What is the relation between mean, median, and mode?
The relationship between mean median and mode is:
Mode = 3 Median – 2 Mean
How to find mean, median, and mode?
Mean, Median, and Mode of any given data set is calculated using the suitable formulas which are discussed above in the articles.
How to find the mean?
Mean is also called the average, it is calculated for ungrouped data using the formula:
- Mean = (Sum of observations)/(Number of observations)
In case of Grouped Data, the mean is calculated by the three methods
- Direct method
- Assumed mean method
- Step deviation method
How to find the median?
Median is the middle term of the data when it is arranged in either ascending or descending order. It is calculated using the formula:
- Median = (n + 1)/2th observation {when n is odd}
- Median = Average of (n/2)th and [(n/2) + 1]th observations {when n is even}
How to find the mode?
The value with the highest frequency is called the mode. Mode is calculated by observation first the given set of values is arranged in either ascending or descending order then the value with the highest frequency is noted as Mode.
Like Article
Suggest improvement
Share your thoughts in the comments
Please Login to comment...