Mode is the most frequently occurring value in a given set of data. It is a measure of central tendency that is used in statistics.
In statistics, the mode is the number that comes the most frequently among a group of numbers. It is one of three measures of central tendency, alongside the mean and median. To determine the mode, count how frequently each number appears. The number that comes the most frequently is the mode. One disadvantage of using the mode as a measure of central tendency is that the data set can have no mode or multiple modes.
For example, if a set of numbers had the digits 1,2,2,3,3,3,4,4,5 then the mode would be 3.
Let’s learn the meaning and formula of mode in statistics with the help of solved examples.
What is Mode ?
Mode in statistics is the value that appears most frequently in a data set. It is a measure of central tendency and can be calculated for both numerical and categorical data.
Unlike mean and median, which calculate the average and middle value of a dataset respectively, mode simply identifies the value that appears most frequently.
Example: In the given set of data: 2, 4, 5, 5, 6, 7, the mode of the data set is 5 since it has appeared in the set twice.
Statistics Mode Meaning
The most frequent value of a set of data.
Mode Definition
Below is the NCERT textbook definition of Mode:
The value that occurs most frequently in a distribution is referred to as mode. It is symbolised as Z or M0.
Mode is a measure that is less widely used compared to mean and median. There can be more than one type of mode in a given data set.
Types of Mode in Statistics
Depending upon the number of modal solutions, mode is classified into the following categories:
- Unimodal
- Bimodal
- Trimodal
- Multimodal
| Type |
Definition |
Example Data Set |
Modes |
| Unimodal |
When there is only one and only one mode in a dataset. |
Set X = {1, 2, 2, 3, 6, 7, 7, 7, 8, 9} |
Only 7 |
| Bimodal |
When there are two modes in the given data set. |
Set A = {1, 1, 1, 3, 4, 4, 6, 6, 6} |
1 and 6 |
| Trimodal |
When there are three modes in the given data set. |
Set A = {2, 2, 2, 3, 4, 4, 6, 6, 6, 7, 9, 9, 9} |
2, 6, and 9 |
| Multimodal |
When there are four or more modes in the given data set. |
Set A = {1, 1, 1, 3, 4, 4, 6, 6, 6, 7, 9, 9, 9, 11, 11, 11} |
1, 6, 9, and 11 |
Note : A dataset without recurring values, however, lacks a mode.
Mode of Ungrouped Data
To find the mode of the ungrouped dataset, we observe the most occurring value in the dataset. The values in the dataset must be rearranged either in increasing or decreasing order.
The value which is appearing the most number of times in the dataset is the Mode of the data.
For determining the mode in case of data is grouped, simple observation does not help. We use a special formula to calculate the mode in case of grouped data is given.
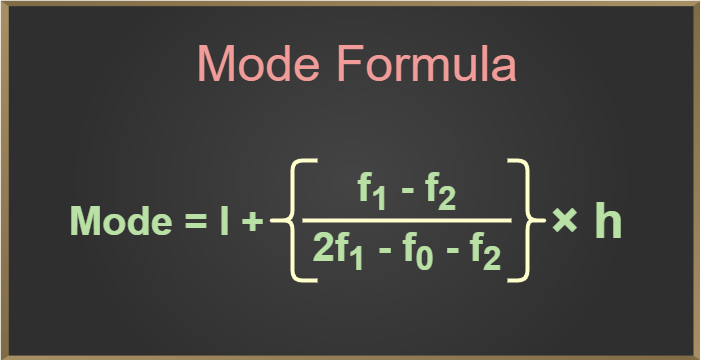
Mode Formula of Grouped Data is as follows :
Mode = l + [(f1 – f0) / (2f1 – f0 – f2)] × h
where,
- l is the lower limit of the modal class.
- h is the size of the class interval,
- f1 is the frequency of the modal class,
- f0 is the frequency of the class preceding the modal class, and
- f2 is the frequency of the class succeeding the modal class.
How to Find the Mode?
Mode for grouped and ungrouped data can be calculated using different methods which are explained as follows:
Finding Mode for Ungrouped Data
To calculate the mode of any given ungrouped data set, we use the following steps:
Step 1: Sort the data in ascending or descending order, whichever is more convenient.
Step 2: Determine the value that occurs most frequently in the data set. This value is the mode.
Step 3: If there are two or more values that occur with the same highest frequency, then the data set has multiple modes.
Let’s consider an example for better understanding.
Example: Find the mode in the given set of data: 4, 6, 8, 16, 22, 24, 41, 24, 42, 24, 15, 13, 61, 24, 29.
Solution:
Arrange the given set of data in ascending order,
4, 7, 8, 13, 15, 16, 22, 24, 24, 24, 24, 29, 41, 42, 61.
The mode of the data set is 24 as it appeared in the given most.
Finding Mode for Grouped Data
Steps for finding the mode of grouped data :
Step 1: Organize the data into a frequency distribution table if not given, which includes the class intervals and their corresponding frequencies.
Step 2: Identify the class interval with the highest frequency i.e., modal class.
Step 3: Observe all the values required in the formula for mode using modal class i.e., l , f1, f0, f2, and h.
Step 4: Put all the values observed in the formula for mode given as follows:
Mode = l + [(f1 – f0) / (2f1 – f0 – f2)]×h
where:
- l is the lower limit of the modal class.
- h is the size of the class interval,
- f1 is the frequency of the modal class,
- f0 is the frequency of the class preceding the modal class, and
- f2 is the frequency of the class succeeding the modal class.
Step 5: Calculate the Mode and round the mode to the nearest value, depending on the nature of the data and the context of the problem.
Mean, Median and Mode
The relationship between Mean, Median, and Mode is given by the formula :
Mode = 3 Median – 2 Mean
Mean Median Mode Comparison
The key differences between mean, median, and mode are tabulated below :
|
|
Definition
|
Calculation
|
Use
|
| Mean |
The average value of a set of numbers. |
Sum of all numbers divided by the total number of numbers. |
Provides a measure of central tendency
that is sensitive to extreme values. |
| Median |
The middle value in a set of
numbers when they are
ordered from smallest to largest (or largest to smallest) |
Arrange the numbers in order and find the middle number. |
Provides a measure of central tendency that is not affected by extreme values. |
| Mode |
The most common value in a set of numbers |
Identify the value that appears most frequently in the data set. |
Provides a measure of central
tendency that is useful for identifying the typical or most frequent value in a data set. |
Points To Remember
Some important points about mode are discussed below:
- For any given data set, mean, median, and mode all three can have the same value sometimes.
- Mode can be easily calculated when the given set of values is arranged in ascending or descending order.
- For ungrouped data, the mode can be found by observation, whereas for grouped data mode is found using the mode formula.
- Mode is used to find Categorical Data.
Merits and Demerits of Mode
Merits and Demerits of Mode are discussed below:
Merits of Using Mode
- Mode is the most frequently occurring term in a series, unlike the isolated Median or the variable Mean.
- It remains stable against extreme values, making it a reliable representation.
- Mode can be identified graphically.
- Knowing the length of open intervals is unnecessary for determining the mode in open-end intervals.
- It is applicable in quantitative phenomena.
- Mode is easily identifiable with just a quick glance at the data, making it the simplest average.
Demerits of Mode
- Mode cannot be determined if the series has multiple modes, like being bimodal or multimodal.
- Mode only considers concentrated values, ignoring others even if they significantly differ from the mode. In continuous series, only the lengths of class intervals are taken into account.
- Mode is highly influenced by fluctuations in sampling.
- Mode’s definition is not as strict. Different methods may yield different results compared to the mean.
- Mode lacks further algebraic treatment. Unlike the mean, it’s impossible to find the combined mode of some series.
- Total series value cannot be derived from the mode alone, unlike the mean.
- Mode can be considered a representative value only when the number of terms is sufficiently large.
- Sometimes, mode is described as ill-defined, ill-definite, and indeterminate.
Practice Problems on Mode
Question 1: Goals Scored by a Football Team
The table below shows the number of goals scored by a football team in 10 matches. Calculate the mode of the number of goals scored by the team.
| Match Number |
Goals Scored |
| 1 |
2 |
| 2 |
3 |
| 3 |
1 |
| 4 |
4 |
| 5 |
2 |
| 6 |
2 |
| 7 |
3 |
| 8 |
1 |
| 9 |
2 |
| 10 |
3 |
Question 2: Favorite Colors of Students
The table below displays the frequency of favorite colors among 50 students. Determine the mode of the favorite color among the students.
| Color |
Frequency |
| Red |
15 |
| Blue |
20 |
| Green |
8 |
| Yellow |
5 |
| Orange |
2 |
Question 3: Ages of Seminar Attendees
The table lists the ages (in years) of a group of people attending a seminar. Find the mode of the ages of the attendees.
| Attendee |
Age (years) |
| 1 |
25 |
| 2 |
30 |
| 3 |
35 |
| 4 |
40 |
| 5 |
45 |
| 6 |
25 |
| 7 |
30 |
| 8 |
35 |
| 9 |
40 |
| 10 |
25 |
Question 4: Number of Chocolates Sold per Day
The table below shows the number of chocolates sold per day by a shopkeeper in a week. Determine the mode of the number of chocolates sold per day.
| Day |
Chocolates Sold |
| Monday |
10 |
| Tuesday |
12 |
| Wednesday |
8 |
| Thursday |
12 |
| Friday |
15 |
| Saturday |
10 |
| Sunday |
8 |
Question 5: Weights of Student
The table lists the weights (in kg) of 20 students in a class. Calculate the mode of the weights of the students.
| Student |
Weight (kg) |
| 1 |
45 |
| 2 |
50 |
| 3 |
55 |
| 4 |
60 |
| 5 |
65 |
| 6 |
55 |
| 7 |
50 |
| 8 |
60 |
| 9 |
65 |
| 10 |
70 |
| 11 |
55 |
| 12 |
50 |
| 13 |
60 |
| 14 |
65 |
| 15 |
70 |
| 16 |
55 |
| 17 |
50 |
| 18 |
60 |
| 19 |
65 |
| 20 |
70 |
Solved Questions on Mode
Let’s solve some example questions on the concept of mode in statistics.
Question 1: Find the mode in the given set of data: 3, 6, 7, 15, 21, 23, 40, 23, 41, 23, 14, 12, 60, 23, 28
Solution:
First arrange the given set of data in ascending order:
3, 6, 7, 12, 14, 15, 21, 23, 23, 23, 23, 28, 40, 41, 60
Therefore, the mode of the data set is 23 since it has appeared in the set four times.
Question 2: Find the mode in the given set of data: 1, 3, 3, 3, 6, 6, 6, 4, 4, 10
Solution:
First arrange the given set of data in ascending order:
1, 3, 3, 3, 4, 4, 6, 6, 6, 10
Therefore, the mode of the data set is 3 and 6, because both 3 and 6 is repeated three times in the given set.
Question 3: For a class of 40 students marks obtained by them in maths out of 50 are given below in the table. Find the mode of data given.
|
Marks Obtained
|
Number of Students
|
|
20-30
|
7
|
|
30-40
|
23
|
|
40-50
|
10
|
Solution:
Maximum Class Frequency = 23
Class Interval corresponding to maximum frequency = 30-40
Modal class is 30-40
Lower limit of the modal class (l) = 30
Size of the class interval (h) = 10
Frequency of the modal class (f1) = 23
Frequency of the class preceding the modal class (f0) = 7
Frequency of the class succeeding the modal class (f2)= 10
Using these values in the formula
Mode = l + [(f1 – f0) / (2f1 – f0 – f2)]×h
⇒ Mode = 30 + [(23-7) / (2×23 – 7- 10)]×10
⇒ Mode = 35.51
Thus, mode of the dataset is 35.51
Question 4: Calculate the mode of the following data:
|
Class Interval
|
10 – 20
|
20 – 30
|
30 – 40
|
40 – 50
|
50 – 60
|
|
Frequency
|
5
|
8
|
12
|
9
|
6
|
Solution:
To find the mode, we need to identify the class interval with the highest frequency. In this case, the class interval with the highest frequency is 30-40, which has a frequency of 12.
Modal class is 30-40
Lower limit of the modal class (l) = 30
Size of the class interval (h) = 10
Frequency of the modal class (f1) = 12
Frequency of the class preceding the modal class (f0) = 8
Frequency of the class succeeding the modal class (f2)= 9
Using these values in the formula
Mode = l + [(f1 – f0) / (2f1 – f0 – f2)]×h
⇒ Mode = 30 + [(12 – 8)/(2×12 – 8 – 9)] × 10
⇒ Mode = 30 + (4/7) × 10
⇒ Mode = 30 +40/7
⇒ Mode ≈ 30 + 5.71 = 35.71
So, the mode for this set of data is approximately 35.71.
What is Mode Definition in Statistics?
Mode refers to the value that appears most frequently in a dataset. It is one of the measures of central tendency, along with the mean and the median.
How is Mode Calculated?
To find the mode of a dataset, you simply look for the value that occurs most frequently. If there are multiple values with the same highest frequency, then the dataset is said to be multimodal.
Can there be Two Modes in a Given set of Data?
Yes, there can be two modes or any greater number of modes for any given data sets as there can be same number of observations repeating the maximum number of times. If the data set has more than one mode, dataset is called multimodal data.
Can the Mode be used with Continuous Data?
Yes, mode can be used for the continuous set of data, but as continuous data has very less chances of any value to repeat it is not an optimum measure for continuous data.
Is it possible for Data to have No Mode?
Yes, it is possible for data to have no mode i.e., when each observation only comes in the dataset exactly once then the dataset is said to have no mode.
What is Mode Formula of Grouped Data?
Mode formula is given for grouped data as follows:
Mode = l + [(f1 – f0) / (2f1 – f0 – f2)] × h
where,
- l is the lower limit of the modal class.
- h is the size of the class interval,
- f1 is the frequency of the modal class,
- f0 is the frequency of the class preceding the modal class, and
- f2 is the frequency of the class succeeding the modal class.
What is the symbol of mode?
The symbol used to represent the mode is ‘Mo’ or sometimes ‘Z’.
What is mode and variance?
Mode refers to the value that appears most frequently in a dataset, while variance measures the spread or dispersion of the data points around the mean.
What if there are 2 modes?
If a dataset has two modes, it is called bimodal. In this case, there are two values that occur with the highest frequency.
What are he three formulas of mode?
There isn’t a specific formula for calculating the mode like there is for mean or median. However, the mode is simply the value that appears most frequently in a dataset. If a dataset is grouped into classes, the mode can be determined by finding the class with the highest frequency.
Can a data have 3 modes?
Yes, a dataset can have three modes. When a dataset has three modes, it is called trimodal. This means there are three values that occur with the highest frequency.
What is mode in function?
In the context of functions, the mode refers to the value(s) of the independent variable that correspond to the maximum value(s) of the dependent variable.
What is mode formula class 9?
In ungrouped data, we can find mode just by arranging the data in ascending and descending order and then finding the value which occurs most frequently. In grouped data we can find the mode by using the following formula, Mode = L + (f 1– f 0/2f 1– f 0– f 2 ) h.
What are the uses of mode?
The mode is used to describe the central tendency of a dataset, particularly when dealing with categorical or discrete data. It is commonly used in fields such as statistics, economics, sociology, and psychology to summarize and analyze data. Additionally, the mode helps in identifying the most common or popular value(s) in a dataset, aiding in decision-making processes.
Share your thoughts in the comments
Please Login to comment...