Sometimes, we look at certain information and process the entire information for a long time, still it becomes hard to remember, especially when the data provided to us is long and complex. This is when human brains start to visualize things in order to make them more memorable, In short, this is what Data Handling does as well, The process of collecting, and presenting data in such a way that it becomes easy for human brains to understand is known as Data Handling. Also known as Statistics, Data handling has been proven to be the most effective way of representing data.
Organizing Raw Data
Before learning about organizing data, let’s think about the term “Data” alone, What is Data?
Data is nothing but systematically recorded values and facts about a quantity. When the data available to us is not systematic or Organized, they are known as Raw Data. Mostly, the data given to us is in form of Raw data, and systematically Organizing them may be in form of either Bar Graph, Pictograph, Double Bar graph, or any other form of visual representation is called as Organization of Raw Data.
Example of Raw data
15 people were asked about their favorite sports, these are the answers given by them,
Cricket, volleyball, tennis, cricket, cricket, tennis, badminton, volleyball, badminton, badminton, cricket, tennis, volleyball, cricket, tennis.
Organizing Raw Data in a Table Format
| Sports |
Number
Of People
|
| Cricket |
5 |
| Volleyball |
3 |
| Tennis |
4 |
| Badminton |
3 |
It is very clear that the data presented in the table form is better to understand and neat, While the raw data is hard to memorize.
The above table is hence, easier to interpret and analyze. The table is known as the Frequency Distribution Table, explaining how many times a particular data is selected.
Frequency
The term frequency in the frequency distribution table tells how many times a particular data has occurred or repeated. For example, In the example mentioned above, The number of people is the frequency, the frequency of choosing cricket as a sport is 5 while the frequency of choosing badminton as a sport is 3, and so on.
Grouped Frequency Distribution
Grouped frequency distribution is used when the data is extremely large and is complex to arrange the frequency of separate data.
For instance, there are 20 students in a class and all of them took a maths test out of 100. All of them passed the test, Following are the marks obtained by them,
35, 31, 80, 44, 50, 67, 89, 40, 45, 66, 71, 86, 56, 59, 69, 67, 82, 92, 43, 57.
Since forming the table for all the data will provide a very large table, It is better to group them separately and then write the frequency for the respective group.
Let’s make group of 10 marks starting from 30-40, 40-50, 50-60, 60-70, 70-80, 80-90, 90-100.
| Marks in group |
Number of students |
| 30-40 |
3 |
| 40-50 |
4 |
| 50-60 |
3 |
| 60-70 |
3 |
| 70-80 |
2 |
| 80-90 |
4 |
| 90-100 |
1 |
Need of Organizing Data
The advantages of organizing data,
Take the previous example and find out which sport is chosen by most people, the answer can be given by both raw data and organized data, but in the latter case, the time consumed to answer the question and the difficulty in answering was a lot less.
- Removes any possible errors.
In Unorganized data, the possibility of error is not zero, there can be errors either while gathering the data or while representing it, however, in Organized data, it is made sure that the data provided is completely correct and without any errors.
- Easy to understand and memorize.
Organized data are visually appealing and are very easily memorized than raw data.
Methods of organizing Data
There are numerous methods of Organizing data, from easy and simple methods like pictograph and Tally marks to methods that can be used for complex and large data like Histograms, bar graphs, and Double bar graphs. Let’s learn about each of these methods in brief,
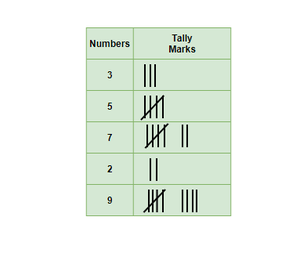
Tally Marks
Tally is the easiest way of understanding numbers and simply marking them in groups. For 1 – 1 mark, for 2- 2marks, for 3- 3marks, for 4 – 4 marks, for 5- cross 4 marks to represent number 5, repeat the same for more numbers.
Below given table explains how Tally marks are represented,
Pictograph
Representing given information in form of Pictures so that the data is in visual form and also easy to understand is a Pictograph. Pictographs can be called the earliest form of not only presenting certain data but also a way of communication when languages were not discovered, the only disadvantage of pictographs is that it is not advised to use when the information is too large and complex since explaining everything in pictures will be tedious.
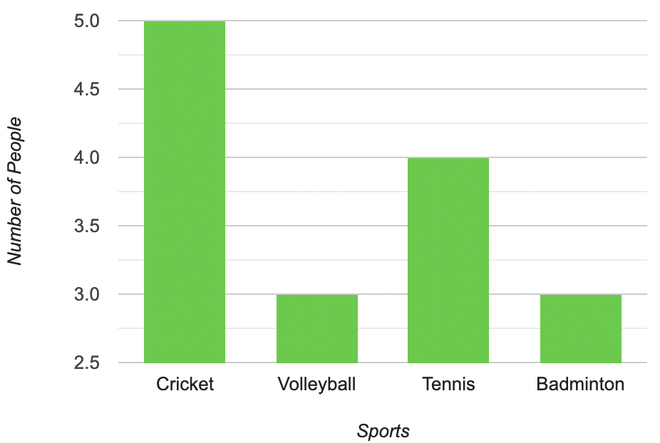
Bar Graph
A graphical way of representing data with long bars, the length of the bars is decided by the frequency of each data. Bar graph are the most commonly used method of organizing data as it helps in identifying the relative size of the data easily and even large amount of data can be fitted in a bar graph with the help of scaling.
Example:
Represent the following table in form of a Bar Graph,
| Sports |
Number
Of People
|
| Cricket |
5 |
| Volleyball |
3 |
| Tennis |
4 |
| Badminton |
3 |
Double Bar Graph
Suppose there are two sets of data that are related to each other and in order to represent two sets of data, two bar graphs are not necessarily required, instead of two separate bar graphs, a double bar graph is suggested in such a case. A Double Bar graph is better since the two separate quantities can be compared very easily. For example, a person is keeping a record of the distance he cycles on his bicycle every day, and he wants to see his improvement in two separate weeks, a double graph for two weeks can be represented for the same.
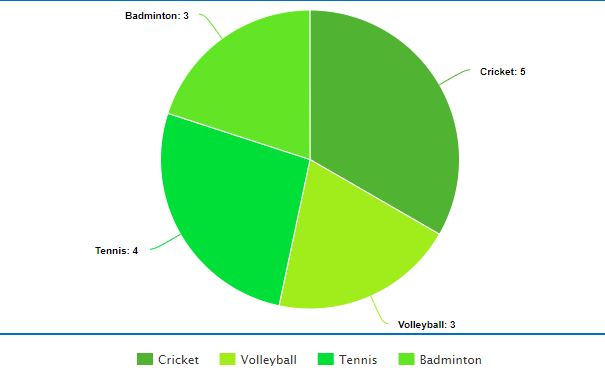
Pie Chart
It is a pictorial representation of data on a circle, the circle disc is known as a Pie as it is in the same shape. The slices on the pie tell the amount of data for each category. The proportional or relative data is best represented on a pie chart as the entire data is easily comparable.
Example,
Represent the following data on a pie chart,
| Sports |
Number
Of People
|
| Cricket |
5 |
| Volleyball |
3 |
| Tennis |
4 |
| Badminton |
3 |
The Pie chart for the above table,
Sample Problems
Question 1: In a span of 3 weeks, a man decides to keep a check on his health and run every morning, he ran each morning and then made a grouped frequency distribution table, the kilometers covered by him are mentioned below, Make the table for the same.
3km, 3.5km, 5km, 4.8km, 6km, 5km, 6.1km, 4km, 5.9km, 7km, 7.2km, 6.3km, 6.8km, 7.1km, 8km, 6.5km, 8.1km, 8.8km, 7.4km, 6.9km, 8.1km,
Solution:
The Grouped Frequency distribution when the groups are divided as, 2-4km, 4-6km, 6-8km, 8-10km shall look like,
| Kilometers Covered |
Number of days |
| 2-4km |
2 |
| 4-6km |
5 |
| 6-8km |
10 |
| 8-10km |
4 |
Question 2: In a Garden, there are 5 different types of flower plants, there are 3 plants of daisy, 5 plants of sunflower, 4 plants of green tulip, 6 plants of rose, 2 plants of dahlia. Make a Pictograph for the above data.
Solution:
The Pictures that represents the number of plants in the garden,

The Pictograph for the data given in question is,

Question 3: Draw a Pie chart for the following data taken from a village, the information is regarding different age groups and in what percentage they are present in the village.
| Villagers age |
Relative population in percentage |
| Infant |
5 % |
| Adult |
35 % |
| Young |
40 % |
| Old |
20 % |
Solution:
The Pie Chart for the above data,

Question 4: Make a Bar Graph for the data obtained from a village in order to obtain information about their age and in what proportional different categories are present.
| Villagers age |
Relative population in percentage |
| Infant |
5 % |
| Adult |
35 % |
| Young |
40 % |
| Old |
20 % |
Solution:
The Bar Graph for the Table given above,

Question 5: Draw Tally Marks for the data obtained about the Number of Plants in a Garden,
Daisy- 3, sunflower- 5, Green Tulip- 4, Rose- 6, Dahlia- 2
Solution:
The Tally Marks For the above data,

Share your thoughts in the comments
Please Login to comment...